What is ILWIS
The Integrated Land and Water Information System (ILWIS) is an open-source Geographical Information Systems (GIS) and Remote Sensing software that was developed by the Faculty of Geo-Information and Earth Observation (ITC). ILWIS was originally designed in 1985 for land use zoning and watershed management, primarily focusing on developing countries. The software was then released in late 1988 but only became free and open-source in 2007.
ILWIS offers an extensive range of elements enabling the user to model not only hydrological processes but also to map hazards and risk zones. Digital mapping and image processing are part of the wide range of features that ILWIS offers that can assist in spatial analysis (52° North - Initiative for Geospatial Open Source Software GmbH, 2015; Faculty of Geo-Information and Earth Observation (ITC), 2011). Some of the features are shown below.
Key features:
- Integrated raster and vector design
- Import and export of widely used data formats
- On-screen and tablet digitising
- Comprehensive set of image processing tools
- Orthophoto, image georeferencing, transformation, and mosaicing
- Advanced modelling and spatial data analysis
- 3D visualisation with interactive editing for optimal view findings
- Animation framework (with optional 3D)
- Auto resampling of different spatial geometries
- Extensive toolset for visual analysis
- Rich projection and coordinate system library
- Geostatistical analyses, with Kriging for improved interpolation
- Production and visualisation of stereo image pairs
- Spatial Multiple Criteria Evaluation
- Web Mapping Service (WMS)
- Web Processing Service (WPS)
- Hydrological modelling
- Surface Energy Balances
- Set of operations on DEMs/DTMs and hydrological processing
ILWIS differs from other common GIS software. As illustrated in Figure 1, the map window is not presented in the main workspace. Instead, there is the option to open the layers in separate windows, and also to combine them into one. Additionally, there is a visible command line available for the users, which can be used to run processes and open all modules.
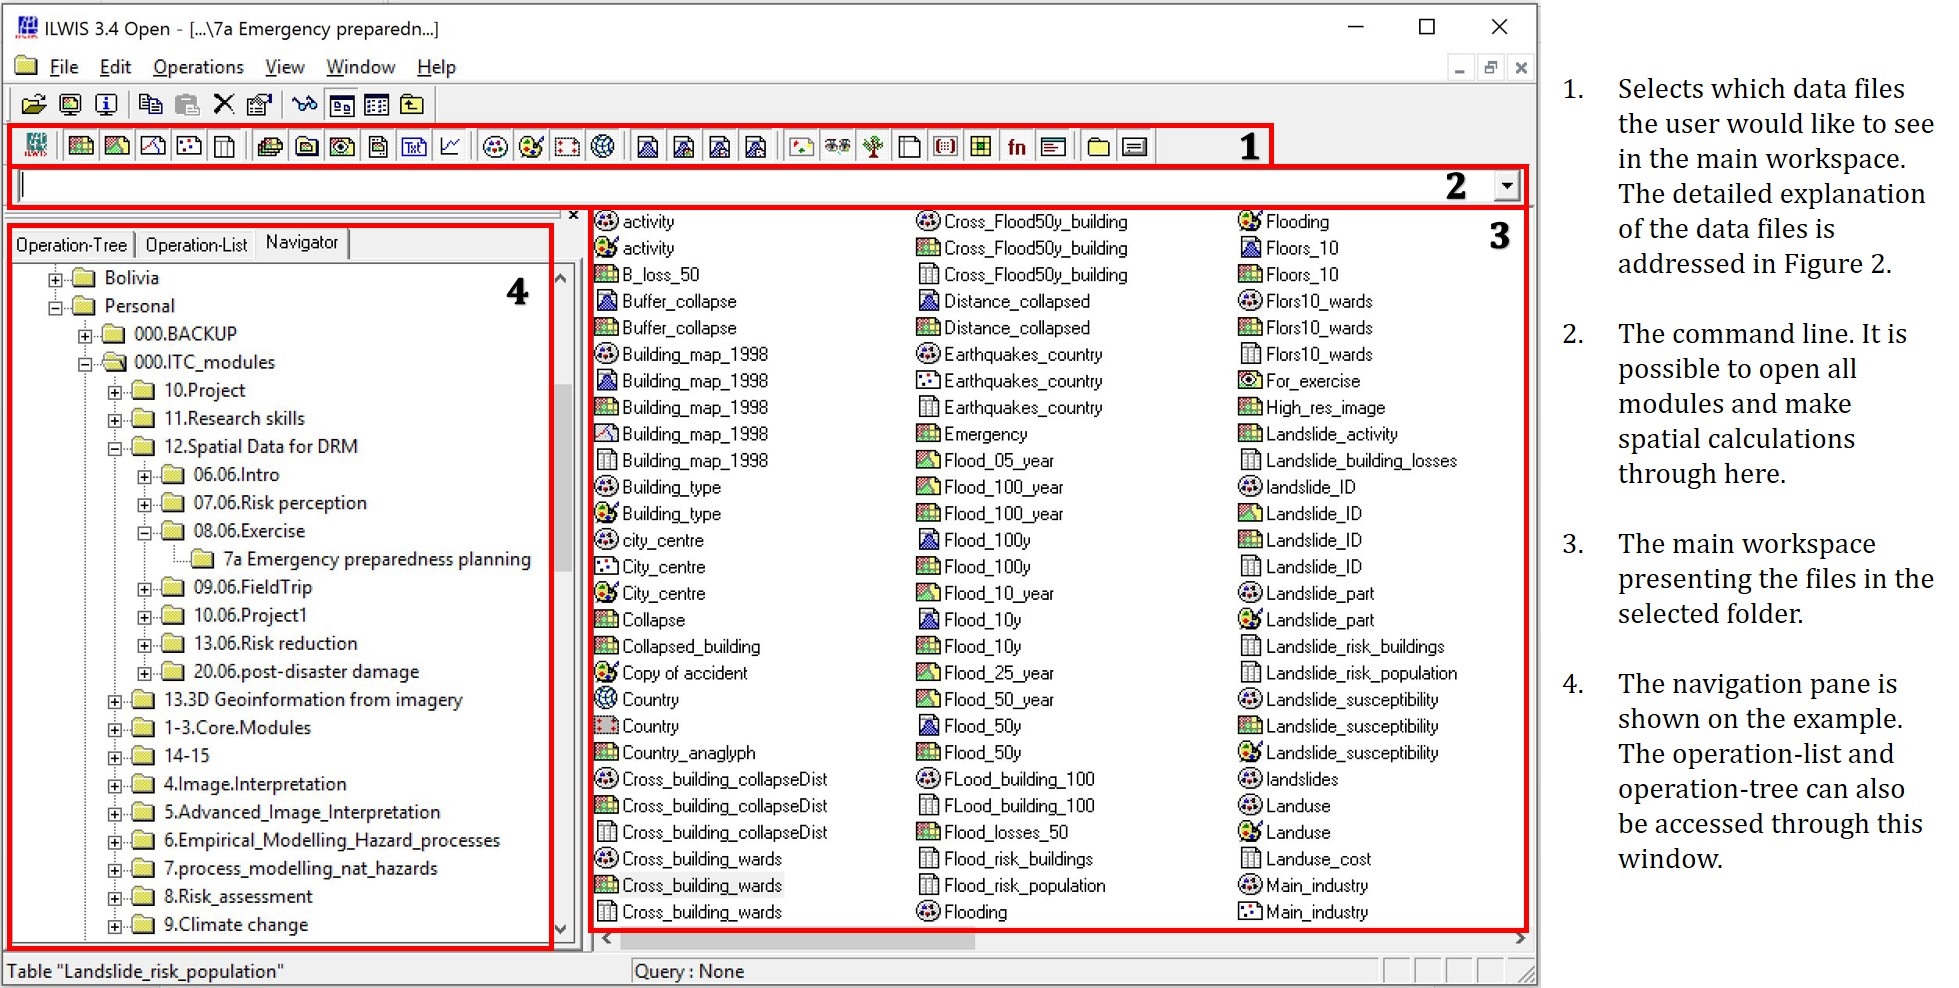
Figure 1. The main workspace illustrating the different panes that can be seen in ILWIS.
The GIS data layers are also grouped into four objects in ILWIS: the data, service, container, and special objects. The data object group is composed of different maps and tables, while the container objects are the collection of data objects, such as map lists, layouts, and map views, for example. The third group is formed by service objects, i.e. they contain the features required by data objects besides the data itself, as domains and representations. The histograms, scripts, and functions, for instance, are grouped in the special objects. In this group, stereo-pairs and criteria-trees can also be found. All the groups and their corresponding objects are described in detail in Table 1.
Table 1. Descriptions and symbols of GIS data icons available in ILWIS.
![]()
ILWIS can also be applied throughout phases of the disaster cycle. Hazards, risk, and vulnerability maps can be developed and analyzed using the software. For instance, Gaprindashvili and Van Westen (2016) developed landslide risk maps using the spatial multi-criteria evaluation (SMCE) feature available in ILWIS. The authors designed, and described in detail, a methodology for the landslide risk assessment in Georgia: Generation of a national landslide hazard and risk map for the country of Georgia (Gaprindashvili & Van Westen, 2016).
Application of ILWIS: Generation of a national landslide hazard and risk map for the country of Georgia (Gaprindashvili & Van Westen, 2016)
This research was developed for the country of Georgia, generating a detailed database of past mass movement events. The data were obtained from archives, media, and existing publications and cataloged using a unified recording structure for each event. This way of cataloging allows the inventory to be updated efficiently with future disaster events (Gaprindashvili & Van Westen, 2016). In order to assess the susceptibility and hazard for Georgia, the national-scale datasets were separated into two factors: the predisposing and the triggering factors. The group of predisposing factors, also referred to as environmental factors, was composed of the elements related to the soil characteristics (e.g. geomorphology, slope steepness, and drainage network). The triggering factors were attributed to rainfall and earthquakes in the region. The gathered data were then made available to the public through the Geoportal of Natural Hazards and Risks in Georgia (drm.cenn.org).
This study was analyzed through the spatial multi-criteria evaluation (SMCE) feature available in ILWIS. A set of spatial criteria was developed to locate the areas where the landslide contributing factors applied. The criteria trees were generated for the factors that contributed to the susceptibility of three types of mass movement: landslide, mudflows, and rockfalls. Subsequently, the criteria were normalized, i.e. the data were converted to range from 0 to 1. Normalizing the data allowed the maps to be compared, where a higher value indicates a higher influence on the susceptibility. Figure 2 summarizes the methodology applied for the susceptibility assessment using SMCE.
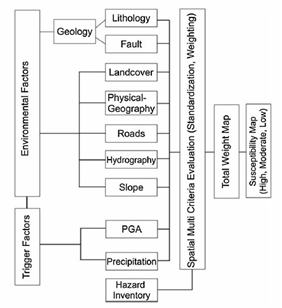
Figure 2. Summarized procedure using SMCE for the mass movement susceptibility assessment in Georgia (Gaprindashvili & Van Westen, 2016).
For this technique using SMCE, the standardized maps were also weighed. The weights were assigned based on the expert’s knowledge, attributing distinct relative importance to different factors, i.e. a higher weight is attributed to a factor with higher influence. The exact weights used for each category can be found in Gaprindashvili and Van Westen (2016). The susceptibility maps for each landslide type were classified into three classes, high, moderate, and low (Figure 3).
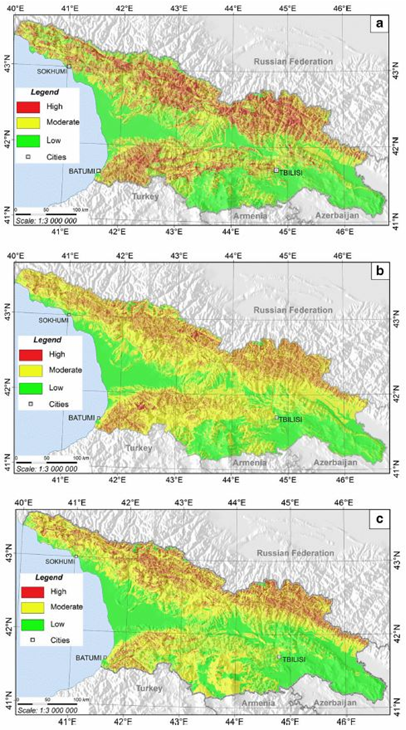
Figure 3. Susceptibility maps generated for the country of Georgia. Maps: a) landslides; b) mudflows; and c) rockfall (Gaprindashvili & Van Westen, 2016).
The exposure analysis for each of the landslide hazard types was also considered during the study in Georgia. For this analysis, the hazard maps were combined with the elements-at-risk in the region. The exposed elements considered were primarily the length of roads, pipelines, the number of buildings, and population. Environmental data, such as natural parks and forests, were also considered. The exposure maps were then evaluated in combination with the national-scale vulnerability analysis to obtain the risk assessment for the area. The summary of the methodology applied for the exposure analysis is illustrated as a conceptual flowchart in Figure 4.
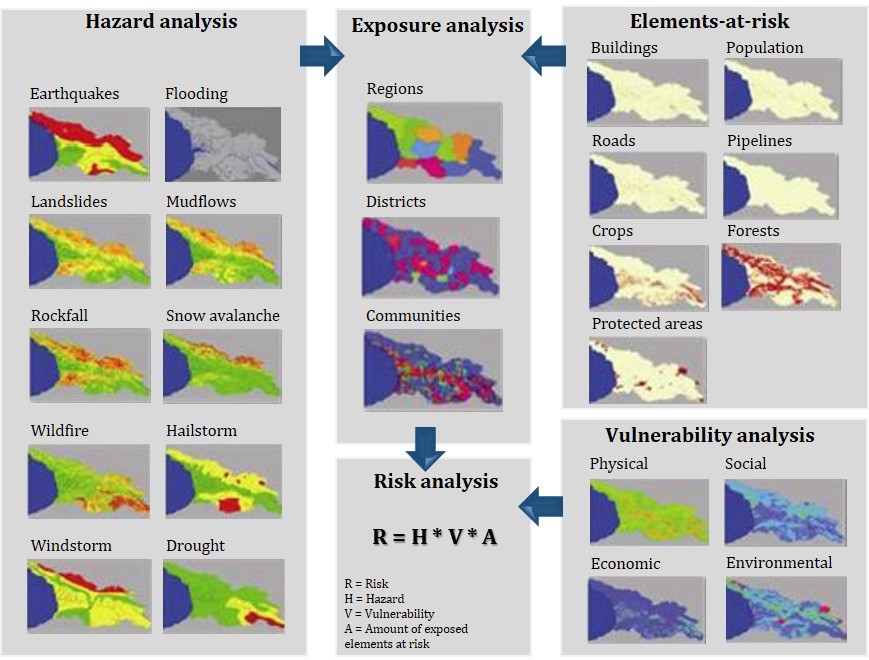
Figure 4. Conceptual flowchart illustrating the applied for the multihazard risk assessment in Georgia (Gaprindashvili & Van Westen, 2016).
During this research, a national-scale landslide inventory for Georgia was generated, including numerous factors in the analysis. These contributing factors were not static, as the elements incorporated in the evaluation can vary in space and time. Therefore, it was essential that the database created could be efficiently updated with future mass movement events.
PDF tutorials developed by Mannaerts, C. and Maathuis, B. (2012)
Tutorial 1: Getting started using ILWIS Open & GEONETCast Toolbox View
Tutorial 2: Introduction to basic ILWIS operations for WFS in Ethiopia View
Videos
ILWIS tutorial
Applicability of SMCE - Part 1
Applicability of SMCE - Part 2
More information
ILWIS - The integrated land and water information system download page Here
More information about ILWIS in 52 North community View
More information about ILWIS in ITC website View
Applications with study cases View
ILWIS User’s guide View
ILWIS community View
References
52° North - Initiative for Geospatial Open Source Software GmbH. (2015). ILWIS Open. Retrieved February 15, 2017, from http://52north.org/communities/ilwis/ilwis-open
Faculty of Geo-Information and Earth Observation (ITC). (2011). ILWIS - Remote Sensing and GIS software. Retrieved February 15, 2017, from https://www.itc.nl/Pub/Home/Research/Research_output/ILWIS_-_Remote_Sensing_and_GIS_software.html
Gaprindashvili, G., & Van Westen, C. J. (2016). Generation of a national landslide hazard and risk map for the country of Georgia. Natural Hazards, 80(1), 69–101.