![]()
United
Nations
Inondation
, processed by ESA, CC BY-SA 3.0 IGO.")
Definition
Facts and figures
Further information
UN-SPIDER Regional Support Offices with hazard-specific expertise
Related content on the Knowledge Portal
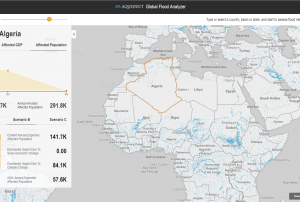 The Global Flood Analyzer by the World Resources Institute is a tool to analyze flood risks. Parameter estimates for urban damage, affected GDP, affected population, annual expected urban damage and annual avoided urban damage for various three scenarios are visualized. Increased impact due to socio-economic change, climate change and future expected damages (2030) are compared against the base case of current annual expected damage. The scenarios are based upon the 5th Assessment report by the Intergovernmental Panel on Climate Change.
For the current scenario, hydrological data from 1960 through 1999 for generating flood inundations for 9 return periods were used, from 2-year flood to 1000-year flood, and 2010 GDP, population, and land use data for assessing flood impacts.
For future projections, 5 GCMs (Global Climate Models) from CMIP5 (Coupled Model Intercomparison Project Phase 5) projecting future flood inundations under two climate scenarios we used,…Publishing institution: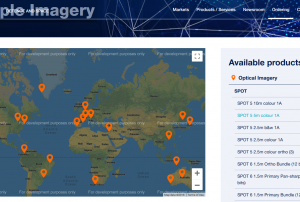 Pleidas, TerraSar-X, SPOT and Elevation data available commercially from airbus, certain sample data sets at various locations available for free.Publishing institution:
 The website: https://www.radiant.earth
Help and Tutorials: https://help.radiant.earth/
Demos & Use Cases: https://demos.radiant.earth/Publishing institution: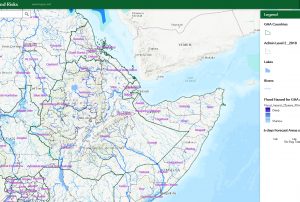 ICPAC drought maps present current rainfall anomaly (Standardized Precipitation Index (SPI)), vegetation anomaly, hydrological condition and rangeland drought monitoring maps. ICPAC Flood Hazard and Risk Maps present flood hazard maps, population estimates, near-real time rainfall 10 day maps from TAMSAT, flood frequency maps for 100 years.
Regional focus: Sudan, Ethiopia, Kenya, Tanzania, Somalia, South Sudan.
TAMSAT is the acronym for Tropical Application of Meteorology Using Satellite Data and Ground-Based Observations which is a rainfall estimation and quality assessment system providing high-resolution (~4 km) , 10-daily (or monthly) pan-African rainfall estimates.
The TAMSAT system is based on two cardinal data sets: 1) Rainfall estimates based on time-lapse analysis of the cloud-top temperature distribution and development observed every 30 minutes (every 15 minutes since July 2006) by thermal infrared (TIR) imagery from aboard the Meteosat…Publishing institution: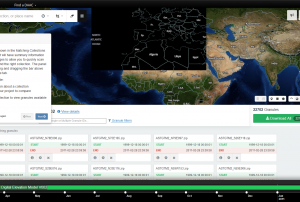 NASA's Earth Observing System Data and Information System (EOSDIS) is a program for archiving and distributing Earth science data from multiple missions to users.Publishing institution:
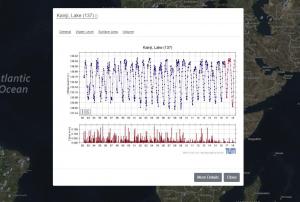 The Database for Hydrological Time Series of Inland Waters (DAHITI) was developed by the Deutsches Geodätisches Forschungsinstitut der Technischen Universität München (DGFI-TUM) in 2013. DAHITI provides water level time series of lakes, reservoirs, rivers, and wetlands derived from multi-mission satellite altimetry for hydrological applications. All water level time series are free available for the user community after a short registration process.
Altimeter Data
For the estimation of water heights, multi-mission altimeter data are used. In detail, altimeter missions such as Topex (NASA, CNES), Jason-1 (NASA, CNES), Jason-2 (NASA, CNES, NOAA, EUMETSAT ), Jason-3 (NASA, CNES, NOAA, EUMETSAT ), GFO (US Navy), Envisat (ESA), ERS-1 (ESA), ERS-2 (ESA), Cryosat-2 (ESA), IceSAT (NASA), SARAL/AltiKa (ISRO, CNES) and Sentinel-3A (ESA) are used.Publishing institution:") GloFAS is an interactive map which presents *forecasted meteorological data*, *predicted hydrological data*, such as stream flows categorized by their probability of occurring (hydrological Return-period), *static maps* of lakes and reservoirs included in the model and *reporting points* where additional forecast information is available.
GloFAS is an interactive map which presents *forecasted meteorological data*, *predicted hydrological data*, such as stream flows categorized by their probability of occurring (hydrological Return-period), *static maps* of lakes and reservoirs included in the model and *reporting points* where additional forecast information is available.
Access to real-time forecasts and forecast reruns from GloFAS is possible through a dedicated ftp service set-up by the GloFAS team upon request. Data is provided either as point time series or 2D grid series, both in netCDF format. Switch-over from version 1.0 to version 2.0 will be transparent to the user, with real-time forecasts from version 2.0 being automatically transferred from the release date, the 14th November 2018. , Requesting data for stations/points (only for river sections with upstream area larger than 1000 km2): Station ID(s), Name of station(s), Name of River(s), Name of country, Station latitude(s)/longitude(s), and Station upstream area(s) from provider (if available).
Requesting data for areas: Latitudes/longitudes of the bounding box regionPublishing institution: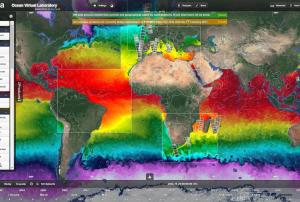 The Ocean Virtual Laboratory is a web platform making satellite and in-situ data for ocean monitoring accessible. It presents one of multiple Syntool Web portals that promote the synergistic use of Ocean Remote Sensing data in a wider context of Oceanic and Atmospheric models or in-situ data. , ESA/SEOM Ocean Virtual Laboratory portal:
SAR roughness Sentinel 1:
Ocean Color: From Sentinel-2, Sentinel-3 and Meteosat.
Chlorophyll: From VIIRS and MODIS
Sea Surface Temperature, Sea level, Salinity, Wind, Current, Rain, Mean Square Slope, Sea ice concentration
, ESA/DUE GlobCurrent portal:
SAR roughness, Ocean Color, Chlorophyll, Sea surface temperature, Sea level, Salinity, Wind, Wave, Current, Rain, ESA SMOS Storm portal: Significant Wave height (SWH) Jason 2 and ALTIKA, SAR roughness Sentinel-1, Wind speed SMOS, SMAP, AMSR2 and ASCAT, wind barbs ASCAT, CNES Aviso'VIZ altimetry portal: Sea Surface Height Anomaly (SSHA) Jason-2 and SARAL, Sea Level Anomaly (SLA) Jason-2 and SARAL, Absolute Dynamic Anomaly (ADT) Jason-2 and SARAL, Mean Sea Level RIse, Sea Level Anomaly, Geostrophic current vectors and streamlines., ESA Sentinel3 Viewer: products from OLCI, SLSTR and SRAL sensors., CNES PEPS Sentinel-1 Ocean Viewer: SAR roughness Sentinel-1, ESA Sea Surface Salinity portal: SMOS salinity, SMAP salinityPublishing institution:-
The Ocean Virtual Laboratory is a web platform making satellite and in-situ data for ocean monitoring accessible. It presents one of multiple Syntool Web portals that promote the synergistic use of Ocean Remote Sensing data in a wider context of Oceanic and Atmospheric models or in-situ data. , ESA/SEOM Ocean Virtual Laboratory portal:
SAR roughness Sentinel 1:
Ocean Color: From Sentinel-2, Sentinel-3 and Meteosat.
Chlorophyll: From VIIRS and MODIS
Sea Surface Temperature, Sea level, Salinity, Wind, Current, Rain, Mean Square Slope, Sea ice concentration
, ESA/DUE GlobCurrent portal:
SAR roughness, Ocean Color, Chlorophyll, Sea surface temperature, Sea level, Salinity, Wind, Wave, Current, Rain, ESA SMOS Storm portal: Significant Wave height (SWH) Jason 2 and ALTIKA, SAR roughness Sentinel-1, Wind speed SMOS, SMAP, AMSR2 and ASCAT, wind barbs ASCAT, CNES Aviso'VIZ altimetry portal: Sea Surface Height Anomaly (SSHA) Jason-2 and SARAL, Sea Level Anomaly (SLA) Jason-2 and SARAL, Absolute Dynamic Anomaly (ADT) Jason-2 and SARAL, Mean Sea Level RIse, Sea Level Anomaly, Geostrophic current vectors and streamlines., ESA Sentinel3 Viewer: products from OLCI, SLSTR and SRAL sensors., CNES PEPS Sentinel-1 Ocean Viewer: SAR roughness Sentinel-1, ESA Sea Surface Salinity portal: SMOS salinity, SMAP salinityPublishing institution: 
Term Parents
UN-SPIDER Regional Support Offices with hazard-specific expertise
![]()