Anak Krakatoa is one of the active volcanoes in Indonesia. Considering its eruption of 23 December 2018 and the tsunami triggered by this eruption, an analysis of the deformation of the cone was conducted during the six months just before that eruption. The analysis was carried out using the “Short Baseline Subset (SBAS)” technique. This use story presents the results obtained.
Morphology
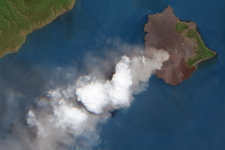
The current Anak Krakatoa volcano is in the Sunda Strait between the islands of Java and Sumatra. It is the remnant of the ancient Krakatoa volcano after its massive eruption of 1883. The small volcanic cone emerged from the sea in 1927, growning quickly throughout the decades and maintaining a permanent activity. In terms of slope stability, the east-northeast flank is covered by dense vegetation cover, while the west-southwest flank has no vegetation due to the constant fallout of volcanic material (ash and rocks).
Data and methods
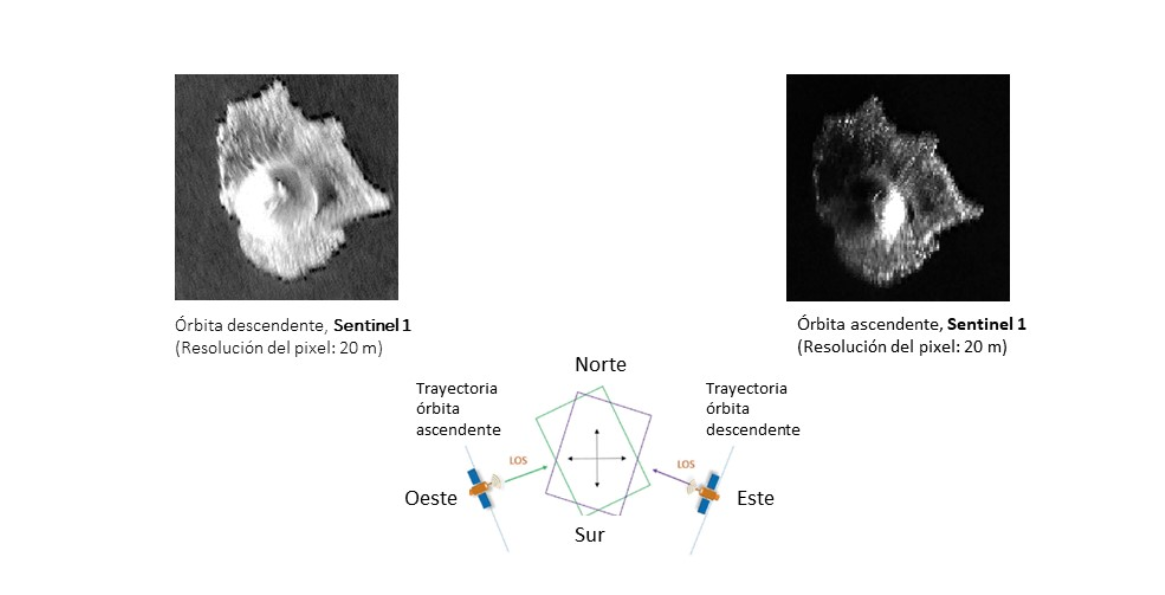
A multi-temporal, radar interferometry analysis was carried out for the period six months before the eruption (from June to December 2018) using the “Short Baseline Subset (SBAS)” (Berardino et al., 2002) technique. The analysis was carried out using satellite imagery acquired by the Sentinel-1 satellite in both the ascending and descending orbits:
- Fourteen Single light Complex (SLC) images in ascending orbit for the period from 27 July to 7 December 2018
- Twelve SLC images in descending orbit for the period from 25 June to 28 November 2018 ) (Figure 1)
The SRTM Digital Elevation Model (90m resolution) was used to remove topographic elements. Using both ascending and descending orbits, the SBAS analysis is useful to detect deformations of the cone on all its flanks by taking into consideration potential shadow effects associated with one type of orbit and the characteristics of radar imagery acquisition. In addition, the analysis using both orbits is useful to assess the effects of other potential geometric distortions (layover, foreshortening).
Results
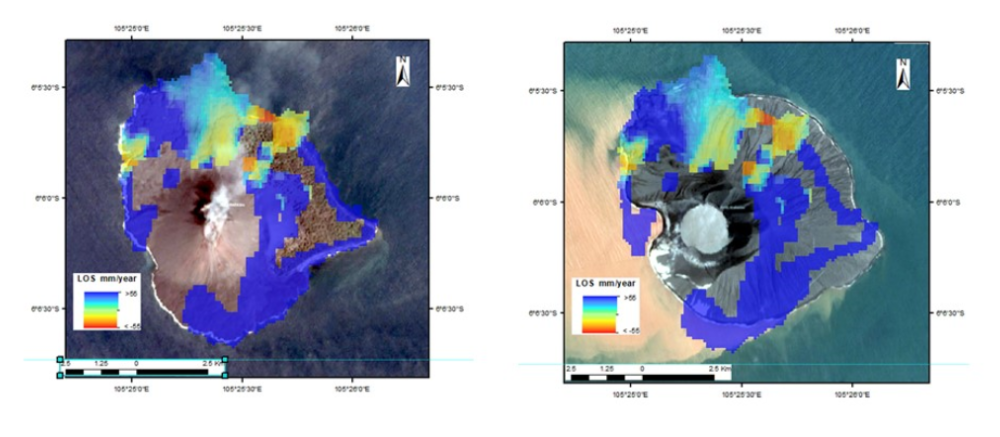
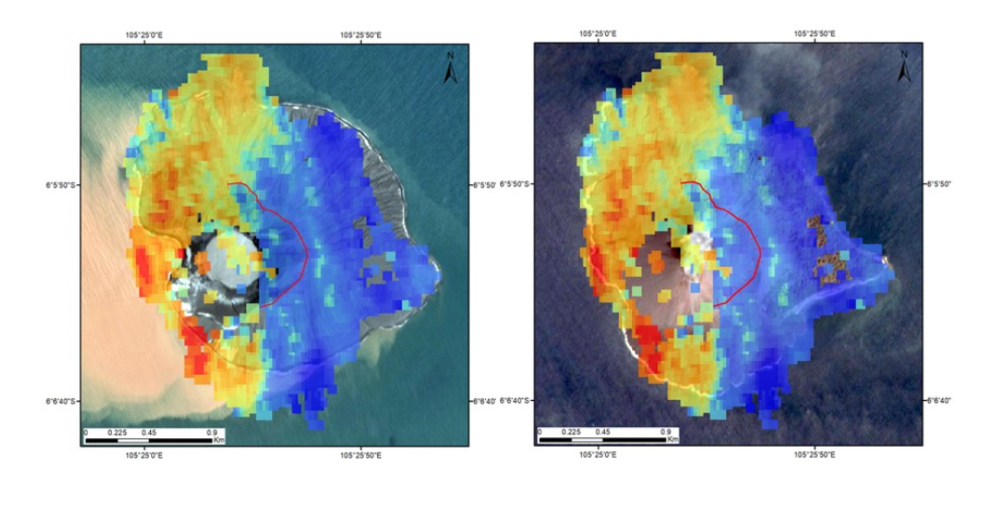
Using the SBAS methodology it was possible to detect evidence of growth or inflation in the eastern flank of the volcano with a magnitude greater than 55 mm (the target moved towards the satellite, pixels with a light blue to blue coloration). This result was similar using satellite imagery acquired in both orbits and is presented in figures 2a and 2b. The results are overlaid on top of optical imagery acquired before and after the eruption.
However, in the western flank, the application of the SBAS methodology led to opposite results depending on the type of orbit used. A negative slope deformation or subsidence was detected using the images acquired during the ascending orbit. The magnitude of the deformation was between -24mm and - 63mm (the target moves away from the satellite, pixels with orange to red coloration). This is presented in figure 2b. This behaviour can occur when the magmatic deposit moves laterally towards a zone of cracks; thus facilitating the collapse of the slope.
In contrast, using the images acquired in the descending orbit, some areas in the western flank were experiencing uplifts in the order of +55 mm.
These opposite results may be due to changes in the backscattering signal of the radar wave as the flanks of the volcano are observed from different angles depending on the type of orbit. For volcanoes like Anak Krakatoa, this difference may be accentuated due to its conical shape. Therefore, it is necessary to use in-situ GPS data or inclinometers that will allow for the validation of the information gathered through InSAR techniques. The differences in the backscattering signals detected using images acquired in the ascending and descending orbits can also be due to the following factors:
- Atmospheric distortions that may delay the radar signal
- Different viewing angles by the satellite (east or west side respect to the target) over steep slopes may increase the geometric distortion of the volcano (layover, foreshortening, shadows)
Nevertheless, if we compare the results gathered using imagery acquired in both orbits, it can be concluded that in the case of this volcano, the use of imagery acquired in the ascending orbit allowed for the observation of the deformation in most areas of the cone of the volcano. This implies that there was a very good coherence among all the pixels in all these satellite images.
In contrast, in the case of images acquired in the descending orbit, there are areas where the coherence was very poor, specifically in the top of the cone and in areas with high vegetation in the eastern flank. In figures 2a and 2b, these areas with poor coherence have not been assigned any coloration, and hence one can see the surface of the volcano using optical imagery.
From the point of view of Earth observation, the collapse of a segment of the flank in the west side of the cone has been an excellent opportunity to demonstrate the value of the high period of re-visit of the Sentinel 1 satellites, and to put to the test these InSAR techniques as tools which could be used in early warning systems. Similarly, this research demonstrated the capabilities of Sentinel-1 radar data to detect slope instability in volcanic environments less than 3 km in diameter.
Acknowledgements
This research was undertaken jointly by the Autonomous University of the State of Mexico (UAEMEX) and UN-SPIDER and benefited from the support provided by the Mexican Council of Science and Technology (CONACYT).