![]()
United
Nations
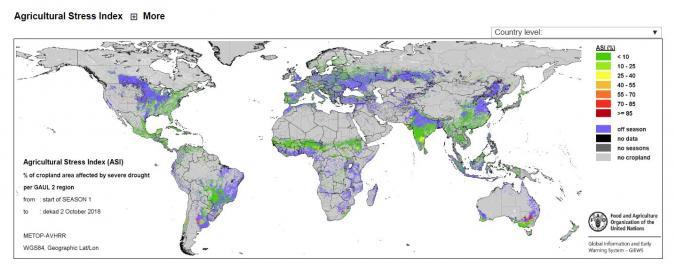
Agricultural Stress Index System (ASIS - FAO)
| Data provided by: | Food and Agriculture Organization of the United Nations (FAO) |
| Data accessibility: | statistical data (e.g. graphs), visualization of data (e.g. web GIS or real time monitoring) |
| Link to the data: | |
| Data type: | hazard specific data |
| Hazard: | Forest Fire, Drought, Flood |
| Disaster cycle phase: | Disaster Risk Management |
| Spatial coverage: | Global |
| Spatial resolution: | 1 km |
| Temporal coverage: | Archive, Near-real time |
| Content dates: | 1984-today |
| Technical Specifications: | |
| Costs: | free |
Provider
![]()