
Around 330-431M ha around the world is affected by forest fire every year (cf. Giglio et al. 2010). Forest fire is a natural hazard which can lead to large destruction of natural areas and livelihoods. It is often defined as an uncontrolled fire in a forest area. Causes of forest fires include lightning, environmental factors such as weather, fuel (accumulation of biomass) and topography, or human activities such as agricultural burning and arson. Small forest fires are a part of the natural system and can benefit the ecosystem by renewing vegetation. However, forest fires that are difficult to control can destroy big settlement areas, ecosystems, human lives and properties. Persistent dry periods with high evaporation and low precipitation increase the risk of forest fires. The presence of strong winds make it even more difficult to control forest fires and increase the damage dramatically. International cooperation networks aim to improve the management of forest fire (e.g. FAO 2006 Fire Management: review of international cooperation) by focusing on response, reconstruction, prevention and preparedness. Satellite imagery contributes to all four phases in the risk management cycle by providing information about forest fire occurrence and factors which can lead to high fire danger.
Content
1. What is satellite-based information for forest fires used for?
2. How are forest fires mapped from space?
2.1 Forest Fire hazard preparedness
2.2 Forest Fire hazard response
3. How can I access relevant data?
4. How is the data used for disaster risk management and emergency response?
4.1 Case Study: Risk Management
4.2 Case Study: Emergency Response
1. What is satellite-based information for forest fires used for?
Forest fires can destroy large areas in a relatively short amount of time and are often difficult to control. Satellite-based information is used to manage forest fires and decrease the negative consequences such as death, health impacts and socio-economic impacts. Satellite data are used for mapping current forest fires, burned areas, damage, emissions, soil erosion, vegetation regeneration and for predicting the likelihood of forest fires (as can be seen in figure 1). This information supports the full disaster management cycle, i.e. reconstruction, mitigation, preparedness, and disaster response.

Figure 1. Use of satellite information for forest fires in the disaster management cycle. Source: European Forest Fire Information System (EFFIS), http://effis.jrc.ec.europa.eu
2. How are forest fires mapped from space?
Sensors on satellites can measure variables on land and in the atmosphere, which are related to forest fires. Thermal sensors measure heat and are used to detect fire hotspots. Infrared sensors are also used to detect emissions. Optical sensors in the visible and near infrared domain are used to map land cover, to identify burnt areas, and to monitor vegetation regeneration. A combination of different space-based and in situ sensors is used for danger forecasts.
2.1 Forest Fire hazard preparedness
In order to increase preparedness, knowledge of the danger of future fires is needed. Improved preparedness gives more time for fire mitigation and preventive actions. Furthermore, it includes the knowledge of what the appropriate response is to different wildfire situations (depending on vegetation, wind etc) and what the plan of action is.
An early warning system improves the preparedness and increases the control over forest fires. Satellite information can provide fire danger ratings based on information about land cover, droughts, and fuel conditions. These ratings can give a warning 4 to 6 hours before the forest fire could be triggered. With satellite information about precipitation, temperature, wind , and relative humidity, indices can be made, which indicate dryness, fuel availability (in the form of litter), and potential spread of fire. A case study using these indices for a Global Early Warning System (Global EWS) for forest fires is provided below in the last section.
Earth observation data (remote sensing data) also contributes to forest fire modeling. Satellite data are used as input for a forest fire models or as calibration data. Input data include precipitation, temperature or relative humidity data for a certain moment. Change detection or information over a time period can be used for calibration of a forest fire model. This is done by comparing the earth observation with the model results. The combinations of models and satellite data form predictive tools supporting preparedness and mitigation efforts (e.g. Global EWS).
2.2 Forest Fire hazard response
A quick hazard response starts with locating the hazard as soon as possible. Fire monitoring is one of the main applications of satellite information and aims to detect a forest fire as soon as it starts. Current fire activity, also called fire hotspots, can be observed by thermal infrared bands on satellite platforms like MODIS. Hotspots can be retrieved from MODIS band 21,22,31,32 (thermal and mid infrared) which detect thermal differences per pixel. If a pixel has a significantly higher temperature than the surrounding pixels, this is likely to be a fire hotspot. When fire hotspots are noticed and calculated by the MODIS Rapid response system, they are registered by the Fire Information for Resource Management System (FIRMS) of MODIS. Additional information will be saved such as latitude and longitude (center point location), confidence percentage, acquisition date, time of the overpass of the satellite, satellite name (Terra or Aqua), scan and track (actual spatial resolution of the scanned pixel), and brightness temperature (BT) of either channel 21 or 22 (in Kelvin). The confidence percentage can be between 0 and 100% and one of the three fire danger classes will be assigned: low-confidence, nominal confidence or high-confidence (Tanpipat 2009). MODIS does not only monitor fire hotspots but also patterns such as burn scars, smoke emissions or vegetation composition and condition. This information can help making predictions about the fire behavior. Additionally, the fuel (litter) consumption combined with the rate of the fire spread can determine the fire intensity. The radiative energy of the fire, which is measured by satellite sensors, can predict the fuel consumption and emissions. All this information contributes to fire behaviour forecasts and to a quick and accurate response.
Another form of data retrieved from satellite imagery is burned area data. One method of mapping this area is making a false colour composite (combining the Red, Near Infrared and Green band), possibly combined with a digital elevation model, followed by a land cover classification. In the land cover classification several land cover classes are selected as ‘Regions of Interest’ such as forests, urban areas and burned areas. The software will then be able to distinguish the burned areas in the satellite imagery and provide a shapefile or map highlighting the burned area. The map with the burned area can be used for damage assessment and to support reconstruction efforts.
Burned areas and fire severity (burn severity) can also be assessed by the Normalized Burn Ratio (NBR). The NBR formula is similar to the NDVI (see Vegetation index application). The only difference is that the NBR uses the Near Infrared (NIR) and Shortwave Infrared (SWIR) bands. The formula looks as follows and can be used in the image calculator or any satellite calculator software:
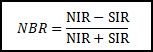
The NBR is normally calculated for a satellite image before and after a forest fire. The extent of the burned area and the severity can be found by calculating the difference between the NBR values before and after the forest fire.
![]()
If the dNBR values exceed a certain threshold value this indicates that the area has been burned. For the fire severity there are several dNBR ranges. In order to assess if an area is burned, the threshold value have to be calculated/determined to make a dNBR classification. These threshold values could be based on historically burned area NBR data of the region of interest (using mean values and standard deviations).
For reconstruction efforts maps of vegetation regeneration are often used, which are created with the use of vegetation indices. Please see the application of vegetation indices for more information about how to use this application (Link).
3. How can I access relevant data?
There are multiple methods for mapping forest fires and different aims, depending on the stage in the disaster management cycle. Therefore, the data needed will be different per disaster management phase. The resolution of the data might affect the costs and the time frequency available. The UN-SPIDER Knowledge Portal provides different data sources and explanations of institutes, sensors and accessibility of the data (e.g. ‘Links & resources’ section).
For forest fire preparedness there are multiple datasets available, which show fire hotspots or fire danger rates for certain regions. Extra data such as precipitation or wind might be needed when using the indices for estimating the forest fire risk.
For the forest fire response/reconstruction mapping, there are data available for mapping burned areas or maps with already located burned areas. Available satellite data with a NIR and SWIR band could be used for calculating the NBR ratio or for erosion, emission, vegetation regeneration and damage assessment mapping.
Preparedness/ Fire Hotspots
- EOSDIS Worldview –NASA gives option for fires and thermal anomalies on an interactive world map. It is possible to export the data and data about temperature or precipitation(for index calculations) can also be found. (Link to data)
- The advanced fire information system provides an interactive map of current fire hotspots (last 48 hours). ( Link to data)
- The United Sates Department of Agriculture (USDA) provides exportable MODIS data (shapefiles or database files etc.) for the USA with detected fires for the last 7 days or per year. (Link to data)
- As mentioned in the case study GOFC-GOLD developed an early warning system based on the Forest Fire Weather Index (FWI). This data is provided in 7 day or monthly forecasts. (Link to data)
- NASA has free active fire data for the last 24,48 or 7 days in shapefile, KML, WMS or text files. (Link to data)
- NOAA STAR has interactive maps with global (or for selected region) fire risk, moisture, drought, and thermal information. The information can be exported for own use. (Link to data)
- For South America RedLaTIF offers several fire pixel maps and fire risk maps. (Link to data)
- The VIIRS sensor coordinated by NOAA, the university of Maryland and the US Forest service registers active fires, which are available in ASCII, KML, png, and GeoTIFF. (Link to data)
- The fire danger forecast, Burned Area and Hotspots by the Global Wildfire Information System of EFFIS from the case study are also available here. (Link to data)
- The active fire data from MODIS FIRMS in shapefile, KML, WMS or as maps can be accessed here.
Burned Areas/ Response
- NASA provides free exportable maps, shapefiles, KML, WMS or text files for Air Quality, Ash/ SmokePlumes, or Vegetation. (Link to data air quality, Link to data ash plumes, Link to data smoke plums, Link to data vegetation)
- Copernicus Global Land Services has Burned Area maps, which can be downloaded here. Registration is necessary and free. (link to data)
Primary Satellite data (for hotspots, burned area calculations etc.)
- ESA (European Space Agency) has exportable data, statistics and visualized data available on request (Link to data)
- USGS provides basic satellite data from different sensors and periods, which could be used for index or burned areas calculations. (Link to data)
- USGS also has a hazard data distribution explorer which also includes data of fire events. This could be used to calculate burned areas or to assess the damage. (Link to data)
- Mapmart provides basic satellite images, but for a fee. (Link to data).
- CNES has imagery of the SPOT satellite to use for own purposes (burned area, indices) (Link to data)
- The ESDI database of the Global Land Cover Facility has satellite imagery and products available from several satellite. This could be used for indices calculation or applications with GIS software. (Link to data)
Precipitation etc.
- Agricultural Stress Index System (ASIS,FAO) for precipitation data (Link to data )
- FEWSNET-USGS-USAID provides precipitation data for free (Link to data)
4. How is the data used for disaster risk management and emergency response?
4.1 Case Study: Risk Management
One system for forest fire risk management is the Global Fire Early Warning System for Wildland Fire (EWS-Fire) by the Global Observation of Forest Cover and Global Observation of Landcover Dynamics (GOFC-GOLD). The Global EWS Fire system is part of ‘A Strategy to Enhance International Cooperation in Fire Management’ by the FAO (2006). The Global EWS-fire system is partly based on the Canadian Forest fire Weather Index (FWI) by Van Wagner (1987), which is one of the most widely used systems. As shown in figure 2, the FWI has six main components: Fine Fuel Moisture Code (FFMC), Duff Moisture Code(DMC), Drought Code (DC), Initial Spread Index (ISI), Buildup Index (BUI) and the Fire Weather Index (FWI).

Figure 2. Canadian Forest Fire Weather Index System (FWI). Based on diagram from GOFC-GOLD http://www.fire.uni-freiburg.de/gwfews/overview.html
The fuel moisture codes (indices) take into account the deep organic soil layers, surface organic matter, and moisture of fine fuels (dead litter). The FFMC represents the litter (fuel) available, which can trigger forest fires, increase the rate of spread and plays a big role in the forest fire risk predictions. DMC and DC can be used as an indicator for risk of lightning ignition and for estimating the difficulty of controlling the fire, respectively. The use of DMC and DC is dependent on the fuel of the forest fire, and is only significant for fuels with organic soil or dead litter. The FWI system has also three indices for the potential behaviour of forest fires: Initial Spread Index (ISI), Buildup Index (BUI) and the Fire Weather Index (FWI). The ISI indicates the potential spread of the fire, which is dependent on the wind conditions. The BUI estimates the fuel which is available for the forest fire, leading to an estimation of a potential severity increase. The main index is the FWI, which indicates fire intensity and is used as an estimation of fire danger. The FWI index is also used for the Daily Severity Ratings (DSR), which rates the difficulty of controlling fires. An example of indication for hazard rating for each index in the FWI system according to the Agriculture and Forestry department of Alberta, Canada can be found here: http://wildfire.alberta.ca/fire-weather/understanding-fire-weather.aspx
The global EWS can make forecasts for up to 7 days. These estimations are also compared with MODIS fire hotspot data and can provide global information according to a globally consistent scale. However the indices should be interpreted differently per region because of differences in the vegetation and climate. The next step is therefore to make Global EWS also applicable per region by including regional factors such as fuel, climate, policy and vegetation. In this process remote sensing data can provide historical data to calibrate the Global EWS per region.
4.2 Case Study: Emergency Response
In order to have fast access to satellite imagery for forest fire response, the USDA Forest Service Remote Sensing Applications Center and the US Geological Survey Center for Earth Resources Observation and Science (USGS EROS) have created a support program named Burned Area Emergency Response (BAER). As soon as forest fires occur, the BAER team processes satellite imagery to generate maps that show the burned areas and the burn severity. Patterns can also be observed and understood for supporting mitigation efforts. The BAER team provides a Burned Area Reflectance Classification (BARC), which shows the condition of the burned area after the forest fire event. This data layer has four classes: high, moderate, low, and unburned. The BARC data layer is the input for generating the burn severity maps and is based on the differences between the near and mid infrared values of the satellite channels. Pre-fire vegetation highly reflects near infrared but not mid infrared. After a fire event, the reflection values will change because the vegetation has been burned: low near infrared reflection but high mid infrared reflection. This is the same principle as the NBR ratio mentioned before. The bigger the ratio difference between the pre and post imagery values is, the more likely it is a burned area. In general the BAER team can provide this information and these maps within two days. These data and maps can subsequently be used for assessing the risk of floods, soil erosion or landslides and to provide the most accurate and effective response.
Further reading: Example of using MODIS data for hotspot locations in Thailand by Tanpipat, V., Honda, K. & Nuchaiya, P. (2009). http://www.mdpi.com/2072-4292/1/4/1043