Water isn't the only thing pouring over Niagara Falls. Pollution from fires in Ontario, Canada is also making the one thousand mile trip, while being measured by NASA's Aqua satellite. One instrument that flies aboard two of NASA's satellites has provided two views of the pollution from the fires in Ontario. The Moderate Resolution Imaging Spectroradiometer, or MODIS instrument, flies onboard NASA's Aqua and Terra satellites. MODIS has provided a visible look at the smoke and pollution that has spread over Niagara Falls and east to Nova Scotia.
As of July 20, the Canadian Interagency Forest Fire Centre (CIFFC) noted that Ontario accounted for 40% of the new fires in the entire country during the week of July 17. The CIFFC reported that so far in 2011, more than 300,000 hectares have burned in Ontario. The Nova Scotia Chronicle Herald reported that smoke from those fires also reached Nova Scotia and Newfoundland by the end of that week.
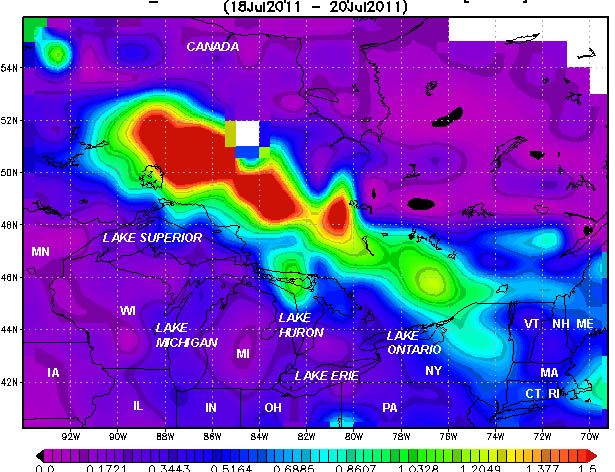
NASA's Aqua satellite passed over western Ontario on July 18, 2011 at 17:58 UTC (1:58 p.m. EDT) and captured a visible image of light brown smoke from wildfires streaming toward the Great Lakes. The MODIS instrument also detects heat signatures and can identify "hot spots" where fires are still burning. Data from the MODIS instrument also helps identify pollution. Data was compiled and averaged using the NASA web-based Giovanni system over the period of July 18-20, 2011. The data provided a measurement of what is called "Aerosol Optical Depth (AOD)." To understand that, think of the atmosphere as an "ocean of air." The depth or amount of aerosols can prevent the transmission of light in the air, just as dirt can block light through the ocean.
Higher values of the AOD measurement mean there are more aerosols (tiny bits of pollution that are also created by soot and smoke from fires) in the air, and less light is getting through the atmosphere. Another prominent aerosol from volcanoes and coal-burning power plants is sulfur dioxide (SO2). Between July 18 and 20, the greatest pollution, or quantity of aerosols were north of the Great Lakes. Over a large area stretching from the north of western Lake Superior east to Lake Huron, particles measured highest at 1.5 molecules per cubic centimeter.
Giovanni is a Web-based application that provides a simple and intuitive way to visualize, analyze, and access vast amounts of Earth science remote sensing data without having to download the data. "One of the advantages of Giovanni is that it allows us to make rapid multi-day averages of daily data from MODIS," said Dr. James Acker, an oceanographer at the Goddard Earth Sciences Data and Information Services Center (GES DISC) who is creating a Giovanni data portal specifically for educators. GES DISC operates out of NASA's Goddard Space Flight Center in Greenbelt, Md. "By averaging the data, we can see the full extent of smoke from the fires, which can be a health hazard," Acker said. "The AOD data also clearly indicates where the smoke is, and distinguishes it from weather clouds."