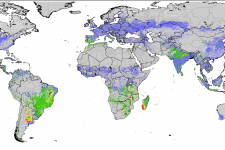
In the framework of the EU/FAO Improved Global Governance for Hunger Reduction Programme, the Food and Agriculture Organization of the United Nations (FAO) is developing the Agriculture Stress Index System (ASIS) to detect agricultural areas with a high likelihood of water stress (drought) at the global level. Based on Earth Observations, ASIS will support the vegetation monitoring activities of the FAO-Global Information and Early Warning System (GIEWS).
The idea behind ASIS is to mimic the analysis that a remote sensing expert would do and simplify the results for the end-users. ASIS will provide a map every ten days in which the GIEWS officers detect “hot spots” for every region where crops may be affected by drought during the growth season. To ensure that the system will not produce false alerts due to external factors such as atmospheric perturbations, the officers then verify the “hot spots” with auxiliary information, for example by contacting the Ministry of Agriculture of the affected country or by monitoring prices of the commodities.
ASIS uses the Vegetation Health Index (VHI), which is derived from the Normalized Differenced Vegetation Index (NDVI). VHI was developed at the United States National Environmental Satellite, Data and Information Service (NESDIS) and has successfully been applied in many different environmental conditions around the globe, including in Asia, Africa, Europe, North America and South America.
The first step in ASIS is to elaborate a temporal average of the VHI at pixel level assessing the intensity and duration of the dry period(s), which occurred during the crop cycle. ASIS is based on ten-day (called a “dekad”) satellite data of vegetation and land surface temperature from the METOP-AVHRR sensor at 1 km resolution.
The second step is the calculation of the percentage of agricultural area affected by drought (pixels with VHI<35 – a value identified as critical in previous studies) to assess the extent of the drought. Finally, the whole administrative area is classified according to the percentage of affected area.
VHI can detect drought conditions at any time of the year. For agriculture, however, the most interesting period is the one most sensitive for crop growth (temporal integration), so the analysis is performed only between the start and end of the crop season. ASIS assesses the severity (intensity, duration and spatial extent) of the agricultural drought and indicates the final results at the administrative level given the possibility to compare it with the agricultural statistics of the country.
Since METOP imagery is only available for 2007 or later, the Flemish Institute for Technological Research (VITO), FAO’s partner in scientific and technical development, simulated METOP data into the NOAA-AVHRR time series through an “inter-calibration” study to obtain a time series from 1984 to 2013. The ASIS database thus contains 30 years of agricultural hot spots, starting with the year 1984 when the Sahel was severely affected by drought. The most affected year by drought of the time series is 1989 when most of the agricultural land suffered from water scarcity. At the end of the first ten day-period of 2014 the most significant hot spots of the main crop season 2013/2014 were detected in Argentina, Brazil, Madagascar, Mozambique, and Tanzania. For example, in Argentina, the main season of maize was severely affected by drought and high temperatures.
From the global version of ASIS, which was designed to detect agricultural hot spots on the globe, standalone versions can be developed to monitor agricultural drought at country or regional level. The standalone versions would be calibrated with local agricultural statistics and they would use specific parameters, coefficients and masks of the main crops of the country or region. ASIS is operational and accessible on the GIEWS website.
Read more here.

