![]()
United
Nations
Inundación
, processed by ESA, CC BY-SA 3.0 IGO.")
Definition
Facts and figures
Further information
UN-SPIDER Regional Support Offices with hazard-specific expertise
Related content on the Knowledge Portal
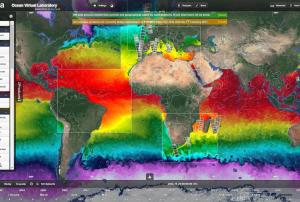 The Ocean Virtual Laboratory is a web platform making satellite and in-situ data for ocean monitoring accessible. It presents one of multiple Syntool Web portals that promote the synergistic use of Ocean Remote Sensing data in a wider context of Oceanic and Atmospheric models or in-situ data. , ESA/SEOM Ocean Virtual Laboratory portal:
SAR roughness Sentinel 1:
Ocean Color: From Sentinel-2, Sentinel-3 and Meteosat.
Chlorophyll: From VIIRS and MODIS
Sea Surface Temperature, Sea level, Salinity, Wind, Current, Rain, Mean Square Slope, Sea ice concentration
, ESA/DUE GlobCurrent portal:
SAR roughness, Ocean Color, Chlorophyll, Sea surface temperature, Sea level, Salinity, Wind, Wave, Current, Rain, ESA SMOS Storm portal: Significant Wave height (SWH) Jason 2 and ALTIKA, SAR roughness Sentinel-1, Wind speed SMOS, SMAP, AMSR2 and ASCAT, wind barbs ASCAT, CNES Aviso'VIZ altimetry portal: Sea Surface Height Anomaly (SSHA) Jason-2 and SARAL, Sea Level Anomaly (SLA) Jason-2 and SARAL, Absolute Dynamic Anomaly (ADT) Jason-2 and SARAL, Mean Sea Level RIse, Sea Level Anomaly, Geostrophic current vectors and streamlines., ESA Sentinel3 Viewer: products from OLCI, SLSTR and SRAL sensors., CNES PEPS Sentinel-1 Ocean Viewer: SAR roughness Sentinel-1, ESA Sea Surface Salinity portal: SMOS salinity, SMAP salinityPublishing institution:-
The Ocean Virtual Laboratory is a web platform making satellite and in-situ data for ocean monitoring accessible. It presents one of multiple Syntool Web portals that promote the synergistic use of Ocean Remote Sensing data in a wider context of Oceanic and Atmospheric models or in-situ data. , ESA/SEOM Ocean Virtual Laboratory portal:
SAR roughness Sentinel 1:
Ocean Color: From Sentinel-2, Sentinel-3 and Meteosat.
Chlorophyll: From VIIRS and MODIS
Sea Surface Temperature, Sea level, Salinity, Wind, Current, Rain, Mean Square Slope, Sea ice concentration
, ESA/DUE GlobCurrent portal:
SAR roughness, Ocean Color, Chlorophyll, Sea surface temperature, Sea level, Salinity, Wind, Wave, Current, Rain, ESA SMOS Storm portal: Significant Wave height (SWH) Jason 2 and ALTIKA, SAR roughness Sentinel-1, Wind speed SMOS, SMAP, AMSR2 and ASCAT, wind barbs ASCAT, CNES Aviso'VIZ altimetry portal: Sea Surface Height Anomaly (SSHA) Jason-2 and SARAL, Sea Level Anomaly (SLA) Jason-2 and SARAL, Absolute Dynamic Anomaly (ADT) Jason-2 and SARAL, Mean Sea Level RIse, Sea Level Anomaly, Geostrophic current vectors and streamlines., ESA Sentinel3 Viewer: products from OLCI, SLSTR and SRAL sensors., CNES PEPS Sentinel-1 Ocean Viewer: SAR roughness Sentinel-1, ESA Sea Surface Salinity portal: SMOS salinity, SMAP salinityPublishing institution: 
 Map Viewer that allows downloading and time series creation of meteosat products.Publishing institution:
 Publishing institution:
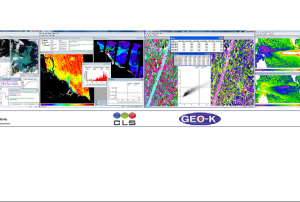
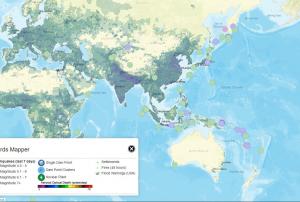 The Hazards Mapper home page is a base map of the world with darker shaded areas indicating higher population densities. Custom population estimates generated by the Hazards Mapper are provided by SEDAC’s Population Estimation Service (PES). Population and settlement data are based on SEDAC’s Global Rural-Urban Mapping Project (GRUMP) and Gridded Population of the World, version 3 (GPWv3) data collections. GPWv3 provides a resolution of roughly 4 km (2.5 miles) at the equator. This population resolution will increase significantly when the updated version, GPWv4, is released in 2016. “Our new population layer will be at a resolution of 1 km (0.6 miles) at the equator, which will give higher precision for smaller areas,” says de Sherbinin.
Continuously updated data layers that can be overlaid on the base map are available from NASA’s EOSDIS, including data from SEDAC; NASA's Land, Atmosphere Near real-time Capability for EOS (LANCE); and Global Imagery Browse..., The default base map includes:
Red dots indicating fires and other hotspots detected over the past 48 hours by NASA’s Moderate Resolution Imaging Spectroradiometer (MODIS) instrument;
Colored circles indicating earthquakes over the past seven days from the USGS Earthquake Hazards Program;
Icons indicating the location of individual dams, dam clusters, and nuclear power plants from SEDAC’s Global Reservoir and Dam and Population Exposure Estimates in Proximity to Nuclear Power Plants, Locations databases; and,
Colored polygons indicating tornado and flood warnings issued by NOAA (U.S. locations only).
Publishing institution: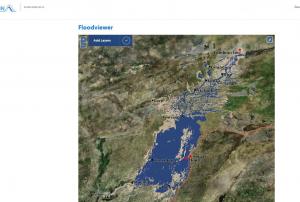 Satellite derived rainfall and flooding estimates based on data from NOAA/FEWS.Publishing institution:
Term Parents
UN-SPIDER Regional Support Offices with hazard-specific expertise
![]()