In Detail: Burn Severity Mapping

A wildfire is a rapidly spreading fire that also occurs in woodland areas. Annual dry seasons or drought provide an ideal environment for biomass and dry conditions to combine; resulting in the creation of fuel, when ignited. Ignition sources for wildfires can be related to natural events, such as lightning strikes and/or lava flow. They can also be man-made, resulting from the burning of debris, unattended campfires, and intentional arson, for example.  


Wildfires can result in the loss of human life. They also have the ability to influence different ecological processes; since they are responsible for partially/completely removing the vegetation layer (Petropoulos, Griffiths, & Kalivas, 2014). They can, therefore, be classified as one of the most widespread ecological disturbances in a natural ecosystem. Wildfires can also affect the dynamics of land cover, at both a spatial and temporal scale; disturbing not only the soil structure, but the composition and competition of species as well (Lhermitte et al., 2011).  Depending on the spatial scale, wildfires are also capable of exerting major influence on the global ecosystem and climate (Running, 2008).

This Recommended Practice can be performed either by using Landsat 8 or Sentinel-2 data. The main difference is the spatial resolution, since the spatial resolution of Sentinel-2 NIR and SWIR bands is 20m, compared to Landsat 8 which is 30m.

Requirements for Landsat 8

  • NIR and SWIR2 images of Landsat 8 (Bands 5 and 7). For Empedrado, Chile, we selected Row 085, Path 001 from the 08th January, representing the pre-fire image. Representing the post-fire image, the 25th February images were used. For the Step by Step about how to download them, please click here.
  • Shapefile of the study area (e.g. Empedrado, Chile). Click here to find where to download the shapefile.
  • Software R-Studio or QGIS. For the Step by Step about how to download the R and R-Studio, please click here.
  • Minimum of 10 GB of available memory in your computer.
  • Basic knowledge of terms used in GIS.

Requirements for Sentinel-2

  • NIR and SWIR images of Sentinel-2 (Bands 8A and 12). For Empedrado, Chile, we selected image from the 20th December 2016, representing the pre-fire image. Representing the post-fire image, the 18th February 2017 images was used. For the Step by Step about how to download them, please click here.
  • Shapefile of the study area (e.g. Empedrado, Chile). Click here to find where to download the shapefile.
  • Software QGIS. 
  • Minimum of 10 GB of available memory in your computer.
  • Basic knowledge of terms used in GIS.

This practice was developed to enable the assessment of large areas that are affected by wildfires. These areas are usually difficult to assess on the ground, hence the use of remote sensing tools.

The Burn severity data can aid in developing emergency rehabilitation and restoration plans, post-fire. It can also be used to estimate the likelihood of future impacts that can be caused by flooding, landslides, and soil erosion.

Strengths
  • The recommended workflow can be easily applied to different areas.
  • The recommended practice was developed using R-Studio and QGIS following the same workflow. These two methods were developed to give the user flexibility to choose which of the open source tools is more practical and convenient.
  • The Normalized Burn Ratio (NBR) that is used during the burn severity assessment is a straightforward (band) ratio to calculate.
  • The methodology recommended uses Landsat 8 or Sentinel 2 images.
Limitation
  • Accuracy of the assessment can be determined through field assessment.
  • To benefit from the difference in spectral response between healthy vegetation and burned areas, the proposed methodology uses the longest portion of the SWIR. This portion is available as a single band in Landsat 8 (SWIR2) and Sentinel 2, however it is not available as a single band in all the sensors.
  • The methodology is suitable to assess large areas.

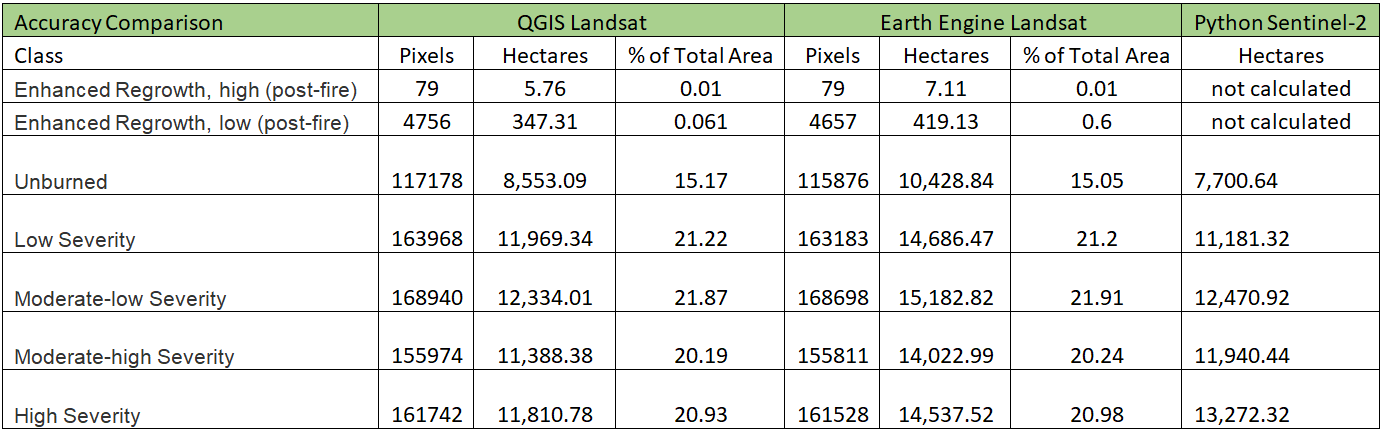
Accuracy comparison of the QGIS and Googel Earth Engine Burn Severity Recommended Practice

  • The accuracy of area calculations is dependent on the software used. In a comparison of the Landsat burn severity practice in QGIS and in Google Earth Engine, although visually the maps produced are identical the calculation of the area by classes varied up to 1% of the total area of the study. This difference in the hectars reported is related to the projection assumptions underlying the precedures. QGIS assumes the global WGS84, while Google Earth Engine assumes regional WGS84 for the specific UTM zone in which you are working. 


A workflow illustrating the steps to assess the burn severity is shown in Figure 1. Independently of the software of choice, the workflow is the same, as well as the results obtained.

The NIR and SWIR bands were used in order to calculate the Normalized Burn Ration (NBR) for the pre- and post-fire scenarios. Delta NBR (dNBR) is then determined through the difference between the pre- and post-fire NBR. Finally, dNBR is classified according to the United States Geological Survey (USGS) standard for Burn Severity assessment. More information on the Normalized Burn Ratio (NBR) index can be found here

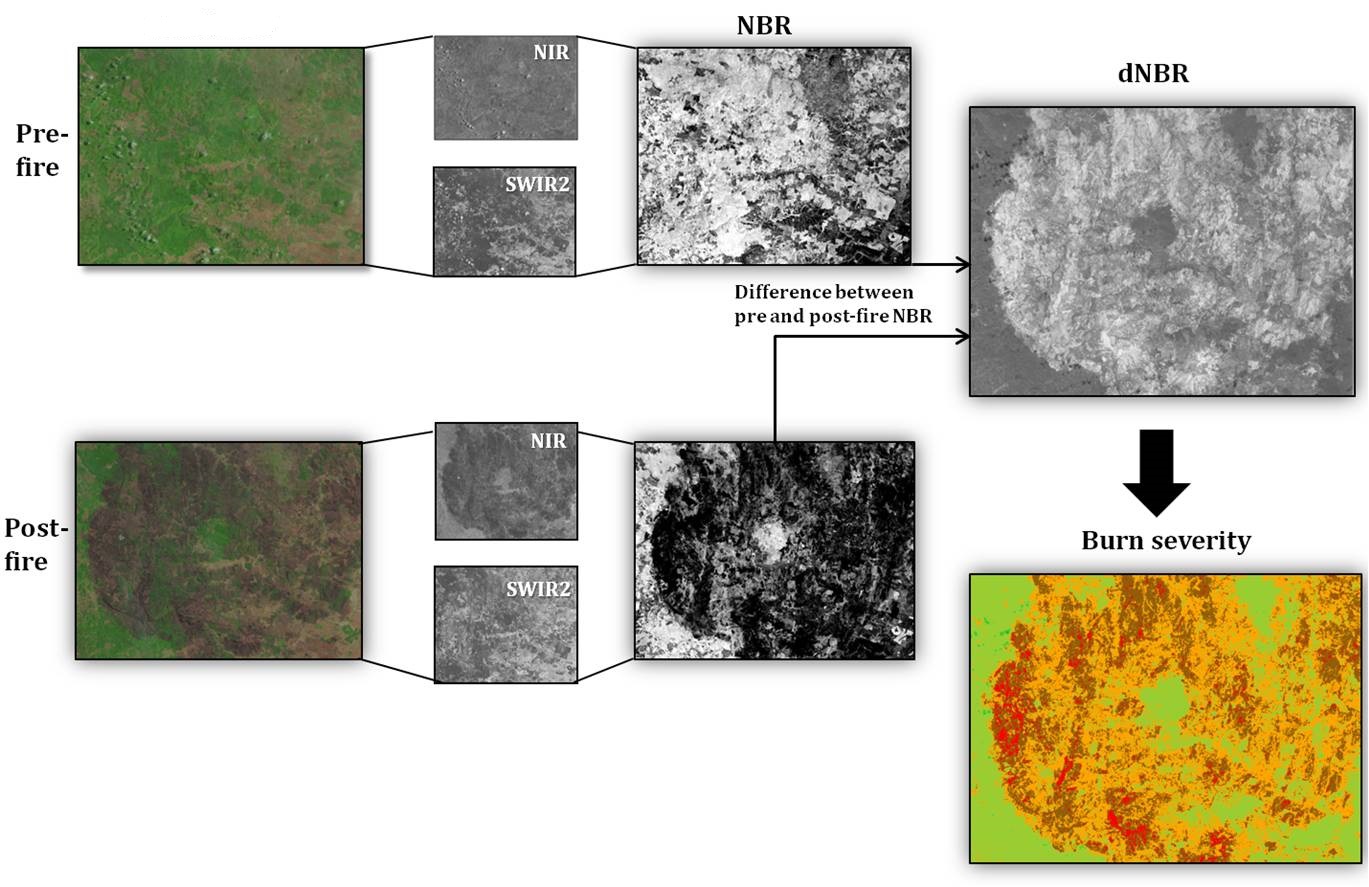
Figure 1. Workflow illustrating the steps for the burn severity assessment.


Albers, C. (2012). Coberturas SIG para la enseñanza de la Geografía en Chile. Universidad de La Frontera. Temuco.

Chu, T., & Guo, X. (2013). Remote sensing techniques in monitoring post-fire effects and patterns of forest recovery in boreal forest regions: A review. Remote Sensing, 6(1), 470–520.

Escuin, S., Navarro, R., & Fernández, P. (2008). Fire severity assessment by using NBR (Normalized Burn Ratio) and NDVI (Normalized Difference Vegetation Index) derived from LANDSAT TM/ETM images. International Journal of Remote Sensing, 29(4), 1053–1073.

Keeley, J. E. (2009). Fire intensity, fire severity and burn severity: A brief review and suggested usage. International Journal of Wildland Fire, 18(1), 116–126.

Lhermitte, S., Verbesselt, J., Verstraeten, W. W., Veraverbeke, S., & Coppin, P. (2011). Assessing intra-annual vegetation regrowth after fire using the pixel based regeneration index. ISPRS Journal of Photogrammetry and Remote Sensing, 66(1), 17–27.

Miller, J. D., & Thode, A. E. (2007). Quantifying burn severity in a heterogeneous landscape with a relative version of the delta Normalized Burn Ratio (dNBR). Remote Sensing of Environment, 109(1), 66–80.

Musyimi, Z., Yahya, M., Zida, D., Rosenstock, T. S., Udelhoven, T., Savadogo, P., … Aynekulu, E. (2017). Evaluating fire severity in Sudanian ecosystems of Burkina Faso using Landsat 8 satellite images. Journal of Arid Environments, 139(December 2016), 95–109.

Parsons, A., Robichaud, P., Lewis, S., Napper, C., Clark, J., & Jain, T. (2010). Field Guide for Mapping Post-Fire Soil Burn Severity. USDA General Technical Report.

Petropoulos, G. P., Griffiths, H. M., & Kalivas, D. P. (2014). Quantifying spatial and temporal vegetation recovery dynamics following a wildfire event in a Mediterranean landscape using EO data and GIS. Applied Geography, 50, 120–131.

Running, S. W. (2008). Climate change. Ecosystem disturbance, carbon, and climate. Science (New York, N.Y.), 321(5889), 652–653.

Sikkink, P. G. (2015). Comparison of Six Fire Severity Classification Methods Using Montana and Washington Wildland Fires. USDA Forest Service Proceedings, (RMRS-P-73), 213–226.