
Land degradation is the reduction or loss of the biological or economic productivity and complexity of rain—fed cropland, irrigated cropland, or range, pasture, forest or woodlands resulting from natural processes, land uses or other human activities and habitation patterns such as land contamination, soil erosion and the destruction of the vegetation cover (UNCCD, 1994). Thirty-three per cent of global land area is degraded (FAO, 2015). About 47 per cent of degrading land globally is forest; cropland accounts for approximately 18 per cent of the global total degraded land (Bai et al., 2013). About two billion people and 1.9 billion hectares of land are affected by land degradation globally (Naseer & Pandey, 2018). It is estimated that land degradation costs the global economy between $18-20 trillion USD annually (UNCCD, 2019). The alarming rates of degradation globally have been recognized and accorded international efforts to help halt and reverse land degradation and combat desertification (ibid.). This is the main aim of Sustainable Development Goal 15 - specifically Target 15.3, which aims to achieve land degradation neutrality by 2030.
The main causative factors of land degradation include: unsustainable land use practices, such as excessive use of chemical fertilizers and mono-cropping; deforestation and vegetation cover changes and loss; soil erosion due to poor soil management practices such as over cultivation of soils or overgrazing; pollution especially soil and water pollution, mainly caused by poor waste management practices; climate change which decreases the natural ability of land to recover and international economic activities e.g. extractive industries (Naseer & Pandey, 2018; Lanfredi et al., 2015; Bai et al., 2006/2008). Underlying causes of land degradation may include among others migration, land shortages and poverty which force people into unsustainable land practices (Nkonya et al., 2011). Weak institutional and policy frameworks further may fail to enforce proper land administration and use (Dubovyk, 2017).
Land degradation leads to loss or reduction in biological productivity of land due to its effect on the ecosystem functioning. Loss of soil organic carbon is estimated to reach 212 Gt by 2050 through unsustainable land management and land conversion (UNCCD, 2019). Soil carbon is a measure of soil health. Global net primary productivity has reduced at least by 5 per cent due to loss of ecosystem functions caused by land degradation, which is estimated at an economic value of between $6.3-$10.6 trillion per year (or 10-17 per cent of global GDP) (UNCCD, 2019).
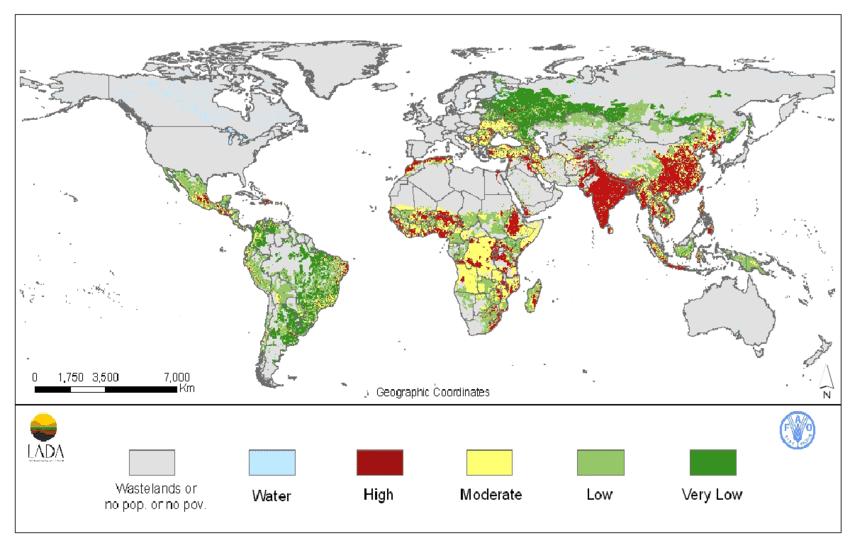
The image above shows results of the GLADIS approach, which is used to monitor the status and trends of land degradation and the pressures applied to the ecosystem functions. It is based on six biophysical and socioeconomic indicators that influence the land degradation process: biomass, biodiversity, soil health, water resources, economic and social-cultural conditions (Nachtergaele et al., 2010). The resulting land degradation classes are a combination of the overall status of the above biophysical parameters applied to the socioeconomic indicators (ibid.). This approach however is restricted by lack of detailed global level data and thus uses a lot of generalizations in its analysis, rendering its applicability and use of products at the local scales less reliable (ibid.).
Table of contents
1. Land degradation and the disaster management cycle
2. How to monitor and assess land degradation from space
2.1. What is needed?
2.2. Approaches
2.3. Limitations
3. Data availability and accessibility (sources)
4. Application of land degradation information for disaster risk management
References
1. Land degradation and the disaster management cycle
1.1. Deforestation, flooding, landslides
Soil degradation is a common feature of LD (both as a cause and an effect of the LD process). Soil degradation is exacerbated by vegetation loss, and in turn causes land to lose its productive efficiency and stability. This further leads to loss of biodiversity, affecting the ecosystem balance and eventually causing alteration of ecosystem functions such as water and energy regulation and provisioning. Deforested slopes for instance are prone to landslides and are a danger to human populations, agriculture, settlements and other physical infrastructure. Degraded coastal land cannot provide protection against flood waters, storm surges and even cyclones/tsunamis. Deforested lands have reduced soil water storage capacity, which increases the run off volume and reduces infiltration, thus increasing the risk of flooding as the natural buffer capacity to control the flooding is hampered. High levels of river siltation can cause further flooding by increasing the sediment load, as demonstrated by the case of the2004 floods in the Ganges River in India (Ali, 2007).
1.2. Drought and human security
Soil erosion and salinization - mostly caused by poor irrigation practices - can result in drought and famine episodes if unchecked in time. Soil is one of the single-most important resources as concerns life on land and thus its mismanagement is critically detrimental to populations worldwide. Land degradation due to soil erosion reduces crop yield and general net biological productivity of land. Consequently, it can lead to a reduction in the extent of productive land available for use. Such a scarcity may lead to land-based resource conflicts as communities scramble for the meager productive resources left. Inadequate or unequal access to healthy and productive natural resources can trigger instability and insecurity as communities compete for scarce water, food, grazing area, energy and other natural resources.
By rehabilitating and restoring degraded lands, land-based jobs (such as agro-forestry, ecotourism, etc.) can be created to cater for migration flows, income and increased production rates (IPBES 2018; UNCCD, 2014). In the US state of Oregon, for instance, about 6000 land rehabilitation projects created about 6500 jobs between the years 2001 and 2010 (UNCCD, 2019). Small holder farmers can gain up to $40 billion in profit if only 12 per cent of degraded agricultural land was rehabilitated (UNDP, 2017). The 3S Initiative, a collective voluntary effort by African Heads of State and Government to stabilize at risk areas by creating jobs for vulnerable populations through large scale investments in land rehabilitation and sustainable management, is founded on the premise of tackling the root causes of migration and instability by “creating 2 million jobs on 10 million hectares of restored land” (UNCCD, 2018). More generally restoring 350 million hectares of badlands is estimated to yield $9 trillion in economic benefits (Besseau et al., 2018). This can be further enhanced through strengthening land registration and rights for at risk and vulnerable populations. Strong property rights especially for land ownership encourage long term investments in land improvement and sustainable land use practices (Wikie et al., 2017; Mirzabaev et al., 2016; UNCCD, 2014).
1.3. Climate change and food security
Climate change is one of the leading causes of loss of biodiversity and ecosystem balance and function. Biodiversity loss can trigger and prolong land degradation, which in turn is a major contributor to climate change and variability. By the year 2050, it is estimated that global crop production would have reduced by at least 10 per cent globally; and up to 50 per cent in some regions of the world, primarily through land degradation and climate change factors. Rehabilitation and reclamation of degraded lands would reduce average carbon emissions and help sequester approximately 1-3 Gt of CO2 annually. LD was responsible for about 3.6-4.4 billion tonnes of CO2 emissions between the years 2000 and 2009 (UNCCD, 2019). This figure has gone higher since. Recent studies show that managing soil carbon by reversing land degradation is the most promising cost-effective high-impact means towards climate change mitigation and adaptation, increased food security and biodiversity conservation (Toensmeier, 2016). The benefits of land restoration are on average 10 times higher than the total costs of in action (SEI, 2018; Nkonya et al., 2016).
2. How to monitor and assess land degradation from space
The basic process of land degradation management involves three steps: assessment, monitoring and implementation of appropriate mitigation measures.
2.1. What is needed?
⮚ Data:
- Aerial photographs/ drone images
- Satellite imagery
- Other ancillary data -optional
⮚ Software:
- Commercial - ERDAS, ENVI, ARGIS, or
- Free and/or Open Source – SNAP, QGIS, GEE etc.
⮚ Skills:
- Image interpretation/processing
2.2. Approaches
Normalized Difference Vegetation Index (NDVI)
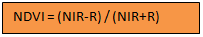
This is a basic measure of vegetation condition and health indicating the quality, quantity and development of vegetation in a given area. The index employs the differential illumination and reflectance of vegetation features in an area. The difference is derived from visible and near infrared portions of the electromagnetic spectrum. NDVI is calculated using the formula below:
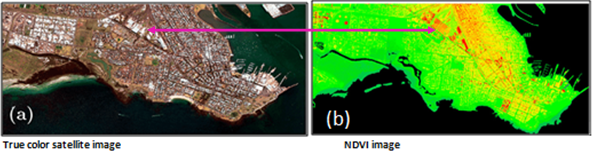
The values generated are usually between -1 and +1. The higher the value the better the vegetation condition and health. Lower values indicate degraded or non-existent vegetation. Built-up or bare areas would exhibit very low NDVI values, for instance. In image (b) below, the red shade represents low NDVI values and corresponds to the built-up areas in image (a).
This index however has its limitations. Climate fluctuations, such as sunshine or rainfall, or disturbances, such as fires, or changes in land use can cause vegetation cover and type to change and thus produce a false alarm when calculating NDVI values for land degradation assessment. To enhance the validity of the NDVI indications, these false alarms have to be considered when doing the measurement (Bai et al., 2008). The Vegetation Quality Index (VGI) is one of the solutions that are used to correct this weakness; or the Residual Trend Analysis (RESTREND) technique (commonly known as the RUE-adjusted NDVI), which decouples NDVI from rainfall variability.
Change detection
Change detection uses images taken at different time periods - usually Date 1 (taken before the assessment period) and Date 2 (taken after the assessment period). These images are then classified using different change detection methods based on factors such as the required spatial resolution, which basically dictates the amount of detail to be shown on the end product. Semi-/automated classification are some of the common methods used.
Indicator monitoring
Different features reflect electromagnetic energy in different signatures and thus can be identified and extracted using different feature extraction methods and software. Indicator monitoring can be done by image interpretation experts through visual image reading of satellite images or aerial photographs; or by computer-assisted methods, such as conducting surface reflectance calculations for both soil and vegetation, among other surface features. Often, a combination of these methods is applied. Some of the indicators used for land degradation monitoring include, but are not limited to:
- Development of long-term surface features such as gullies, rills, sand dunes, badlands, salt crusts and other detectable soil surface salinity features, etc.
- Condition and spatial variability of natural vegetation, crop cover, soil, erosion features such as gullies, etc (Metternicht et al., 2010). Most soil indicators need to be assessed using hyper-spectral data which is currently expensive to obtain and can only be used for small areas. Vegetation indicators on the other hand have been used for a long time now and thus have much developed methodologies and easily accessible data sources. Medium and coarse resolution satellite data, such as Landsat and MODIS, are the common data sets used for this purpose. Vegetation greenness, cover extent and biomass are some of the common proxies used to assess land degradation.
Floods and landslides
Floods and landslides can indicate locations where degradation is likely to occur firstly due to the indiscriminate sweeping action of the two forces, washing away vegetation and fertile top soils. Alternatively, landslides and flood events can indicate locations where land degradation has already occurred and thus the land has its capacity to buffer against such disasters.
Other methods
- Rain Use Efficiency (RUE), defined as the ratio of net primary productivity to precipitation over a given time (Dubovyk, 2017; Tagore et al., 2012).
- Environmental sensitivity, measured by the Environmentally Sensitive Areas (ESA) index. This methodology is used to assess the structural vulnerability of land to degradation and identify possible factors that can cause/trigger the process of degradation on such land (Lanfredi et al., 2015).
- The GLADA approach, a sequence of analyses: 1) calculate NDVI for mean annual and trend biomass productivity, 2) then integrating the result with climate data (rain use efficiency) and thereafter 3) linking it to net land productivity (calculate changes in biomass production for dominant land use types), 4) finally land stratification based on land cover, soil and terrain data. This results in localized NDVI analysis (Bai & Dent, 2006).
| Land degradation indicator |
Description |
Studies |
|---|---|---|
|
Land Cover |
Land cover data provides fundamental baseline information for land degradation assessments and monitoring. Changes in land cover may serve to indicate where degradation is likely to occur given certain conditions. For instance, bare/less vegetated grounds are more prone to wind and water erosion, thus higher possibility to be degraded. |
Hu et al., 2019; Gichenje & Godinho, 2018; Mekonnen et al., 2018; Moges et al., 2018; Zoungrana et al., 2018; Li et al., 2015; Vieira et al., 2015; Bajocco et al., 2012; de Jong et al., 2011; Gao & Liu, 2010; Dumanski & Pieri, 2000 |
|
Crop Yield |
Crop production depends on fertile soils, rainfall among other factors. Poor crop yield may serve to indicate poor state of the soils largely due to soil degradation in the given area |
Sonneveld et al., 2016; Tun et al., 2015; Dubovyk et al., 2013, Dumanski & Pieri, 2000; |
|
Vegetation condition (NDVI/ VCI) |
Higher NDVI/VCI values indicate healthy status and condition of vegetation while low values indicate poor condition and health of the vegetation, such as that on a degraded land. |
Brema et al., 2019; Gichenje & Godinho, 2018; Zoungrana et al., 2018; Graw et al., 2017; Riva et al., 2017; Eckert et al., 2015; Ibrahim et al., 2015; Lanfredi et al., 2015; Li et al., 2015; Yengoh et al., 2015; Yengoh et al., 2015a; Vicente-Serrano et al., 2015; Omuto et al., 2009; Bai et al., 2008a; Vargas et al., 2007; Wessels et al., 2004; Lanfredi et al., 2003; Thiam, 2003 |
|
NPP/Biomass |
Average reduction in biomass and NPP indicate degradation as they result in a reduction in the capacity of land to sustain and recover from disturbances. Such land is often in a degraded state. |
Dwivedi, 2018; Hermans-Neumann, et al., 2017; Gao et al., 2016; ; Le et al., 2016, Sutton et al., 2016; Taelman et al., 2016; de Jong et al., 2011 |
|
Soil degradation/ erosion/ sedimentation |
Soil erosion is a prerequisite condition for most land degradation processes and also a result of the land degradation process. |
Dwivedi, 2018; Alatorre et al., 2012; Jain & Das, 2010; Ravi et al., 2010; Omuto et al., 2009a; de Vente et al., 2008; de Vente & Poesen, 2005; Dumanski & Pieri, 2000 |
|
Soil water index / soil moisture index |
Soil water stress is a common feature of degraded land. The amount of moisture present in soil indicate suitability of land for different uses and has direct influence on food security, biomass production and ecosystem functioning. |
Dwivedi, 2018; Gao et al., 2016; Ibrahim et al., 2015; Ravi et al., 2010; Kerr, 2007; De Rosnay et al., 2006; Boix-Fayos et al., 2001 |
|
Biodiversity |
Indicated by reductions in number of fauna or/and flora species, loss of key habitats, these losses are mostly associated with vegetation losses. Loss of carbon soil as a result of erosion can also cause vegetation cover depletion which would then trigger biodiversity loss. Negative trends in biodiversity may serve as proxy for degradation |
Gisladottir & Stocking, 2005; Scholes & Biggs, 2005; Tanser & Palmer, 1999 |
A comprehensive land degradation assessment involves analyzing and mapping four elements:
- The type of degradation (salinization, wind/soil erosion, drought etc)
- The cause (s) (for instance mining, deforestation, overgrazing etc)
- The extent of degradation (the total physical area affected)
- The severity of degradation (usually. classified as light or moderate or strong or extreme)
Further actions in the land degradation management process may include:
- Assessing the impacts of land degradation- e.g. through time series analysis, change detection, participatory mapping, vegetation productivity estimates, vegetation indices
- Decision support on possible intervention and rehabilitation options- e.g. through land degradation modeling
- Assessing the impacts of intervention activities- e.g. through time series analysis, change detection, spectral transformation, vegetation productivity estimates, vegetation indices
2.3. Limitations
Some of the limitations of using space based information for land degradation assessment and monitoring include:
- Differences in resolution of data sources (spatial, radiometric, temporal etc) used to assess land degradation
- Spectral similarity of surface features associated with land degradation
- One feature can characterize many degradation processes, making it difficult to attribute a single feature to a single degradation process (Metternicht et al., 2010)
- Lack of standardized methodology and tools to assess and map land degradation
- Scarcity of field data (Dubovyk, 2017) and suitable/usable/ affordable satellite images (Yengoh et al., 2018)
- Lack of a globally agreed definition of land degradation
- Lack of standardized indicators for the measurement of land degradation attributes (Dubovyk, 2017)
However, to overcome some of the above and other challenges that come with this technology and improve the accuracy of the output assessments, one should critically consider:
-
The complexity of the landscape that is being analyzed
-
Selection of the right kind of satellite data to be input into the analysis process (understanding the characteristics strengths and weaknesses of different sensor data). Elements to consider include scale, availability and coverage of the data; cost and processing requirements including the analyst’s skills with the given data type (Lu & Weng, 2007)
-
The approaches employed to process and classify the images
3. Data availability and accessibility (sources)
Aerial photographs/Drone images as well as satellite imagery from multiple sensors can be used to do land degradation assessments. Such sensors include, but are not limited to, Landsat, SAR ERS-1, SPOT-XS, JERS-1 SAR, Radarsat, IKONOS, Sentinel, Worldview 1/2/3, AVHRR (NDVI), ASTER, MODIS.
Below are examples of data sets used to do these assessments and respective links to the data sources.
Vegetation / Land use / Land cover
|
Data set |
Provider |
Description |
Link |
|---|---|---|---|
| Global Inventory Monitoring and Modeling System (GIMMS)- a product of AVHRR |
University of Maryland - Department of Geography |
The GIMMS (Global Inventory Modeling and Mapping Studies) data set is a normalized difference vegetation index (NDVI) product available for a 25 year period spanning from 1981 to 2006. The data set is derived from imagery obtained from the Advanced Very High Resolution Radiometer (AVHRR) instrument onboard the NOAA satellite series 7, 9, 11, 14, 16, and 17. This is an NDVI data set that has been corrected for calibration, view geometry, volcanic aerosols and other effects not related to vegetation change. The current release of this data set, added to the Data Library on 06 August 2010, contains NDVIg data on a global geographic projection (evenly spaced in latitude and longitude) for the period July 1981 to December 2006. For each grid point there are two values per month, the maximum NDVI value for the first fifteen days of the month, and the maximum value for the remainder of the month. | URL |
|
Normalized Difference Vegetation Index (NDVI) - 3rd Generation |
National Aeronautics and Space Administration (NASA) | The NDVI time series- 3RD Generation is calculated using the Global Inventory Monitoring and Modelling System (GIMMS). It is carefully assembled from different AVHRR sensors and accounting for various deleterious effects such as calibration loss, volcanic eruptions, orbital drift etc. The latest version of this data set spans the period 1981-2015. | URL |
| STAR - Global Vegetation Health Products | National Oceanic and Atmospheric Administration (NOAA) | This is a system for estimating vegetation health, moisture condition, thermal condition and the vegetation products. It contains Vegetation Health Indices derived from the radiance observed by the Advanced Very High Resolution Radiometer (AVHRR). The vegetation Health products from AVHRR have been produced from the NOAA/NESDIS Global Area Coverage data set since 1981. The data and images have a 4 km spatial and 7-day composite temporal resolution. The products can be used as proxy data for monitoring land degradation, vegetation health, drought, soil saturation, soil moisture and thermal conditions, fire risk, greenness of vegetation cover, vegetation fraction, leave area index, start/end of growing season, crop and pasture productivity, desertification, teleconnection with ENSO, mosquito-borne diseases, ecological resources etc. |
URL |
| Land cover | European Space Agency | The European Space Agency's Climate Change Initiative generated a suite of products among them Land cover. In the first phase 3 consistent global Land Cover (LC) products corresponding to the 1998-2002, 2003-2007 and 2008-2012 periods, climatological 7-day time series representing seasonal dynamics of the land surface, Medium Resolution Imaging Spectrometer (MERIS) Surface Reflectance (SR) time series which served as input for generating the global land over maps. In addition, a global Water Body (WB) product was derived from the Envisat Advanced Synthetic Aperture Radar (ASAR) archives. The second phase of project, started in March 2014, led to a set of new and improved products: SR time series of Advanced Very High Resolution Radiometer (AVHRR) and PROBA-V, global annual and consistent LC maps from 1992 to 2015 and new versions of the global map of open water bodies. | URL |
| Forest Observation System | The Forest Observation System | The Forest Observation System is an international cooperation to establish global in-situ forest biomass database to support earth observation and land surface modelling. The system provides well curated biomass plot data in a unified format, which is aggregated from tree level data consistently across different networks. | URL |
| Global forest cover change (GFCC) | University of Maryland - Department of Geographical Sciences | This data set presents results from time-series analysis of Landsat images characterizing forest extent and change. Trees are defined as vegetation taller than 5m in height and are expressed as a percentage per output grid cell as ‘2000 Percent Tree Cover’. ‘Forest Cover Loss’ is defined as a stand-replacement disturbance, or a change from a forest to non-forest state, during the period 2000–2018. ‘Forest Cover Gain’ is defined as the inverse of loss, or a non-forest to forest change entirely within the period 2000–2012. ‘Forest Loss Year’ is a disaggregation of total ‘Forest Loss’ to annual time scales. Reference 2000 and 2018 imagery are median observations from a set of quality assessment-passed growing season observations. |
URL |
| Landsat | National Aeronautics and Space Administration (NASA) & United States Geological Survey (USGS) | The Landsat program offers the longest continuous space based global imagery of the Earth's surface. The data serves as a valuable resource for several applications including land use land cover change, forestry, geology, agriculture, regional planning and education. Level-1 data products are used to create higher-level science data such as surface temperature, surface water, burned area and snow covered area. Landsat Level-2 and Level-3 Science Products contain higher-level data to allow scientists to better document changes to Earth's terrestrial environment. Landsat Analysis Ready Data (ARD) are processed to highest scientific standards, and placed in a tile-based structure to support time-series analysis. Landsat Collections ensures that the data in the Landsat Level-1 archive are consistent in processing and data quality to support time-series analyses and data stacking. | URL |
| Copernicus Global Land Service (CGLS) | European Commission Joint Research Centre | The Copernicus Global Land Service (CGLS) is a component of the Land Monitoring Core Service (LMCS) of Copernicus, the European flagship programme on Earth Observation. The Global Land Service systematically produces a series of qualified bio-geophysical products on the status and evolution of the land surface, at global scale and at mid to low spatial resolution, complemented by the constitution of long term time series. The products are used to monitor the vegetation, the water cycle, the energy budget and the terrestrial cryosphere. | URL |
Soils
| Harmonized World Soil Database | Food and Agriculture Organization of the United Nations | The Harmonized World Soil Database is a 30 arc-second raster database with over 15 000 different soil mapping units that combines existing regional and national updates of soil information worldwide (SOTER, ESD, Soil Map of China, WISE) with the information contained within the 1:5000000 scale FAO-UNESCO Soil Map of the World (FAO, 1971-1981). The resulting raster database consists of 21600 rows and 43200 columns, which are linked to harmonized soil property data. The use of a standardized structure allows for the linkage of the attribute data with the raster map to display or query the composition in terms of soil units and the characterization of selected soil parameters (organic Carbon, pH, water storage capacity, soil depth, cation exchange capacity of the soil and the clay fraction, total exchangeable nutrients, lime and gypsum contents, sodium exchange percentage, salinity, textural class and granulometry). | URL |
| Soil and terrain database (SOTER) | International Soil Reference and Information Centre ( World Soil Information) | This is a standard for developing soil and terrain databases, which consist of a map (in GIS polygon format) that delineates the SOTER map units and a set of tables in a relational database (in MS Access or PostGreSQL format) with terrain and soil data. The information in the table can be linked to the units of the map. SOTER databases provide data on key soil and terrain properties that are relevant input to agro-environmental applications such as food projection studies, climate studies (carbon sequestration), land evaluation or hydrological catchment modelling. | URL |
| Slope elevation United States Geological Survey (USGS) | Shuttle Radar Topography Mission (SRTM) | The Shuttle Radar Topography Mission provided digital elevation models on a near-global scale used to generate high resolution digital topographic database of the earth. | URL |
| Soil Moisture Active Passive (SMAP) | National Aeronautics and Space Administration (NASA) | The Soil Moisture Active Passive (SMAP) satellite maps global soil moisture and detects whether soils are frozen or thawed. This mission helps scientists understand the links between Earth's water, energy and carbon cycles; reduce uncertainties in predicting weather and climate; and enhance our ability to monitor and predict natural hazards such as floods and droughts. | URL |
| Soil water index | European Commission Joint Research Centre | The Copernicus Global Land Service (CGLS) is a component of the Land Monitoring Core Service (LMCS) of Copernicus, the European flagship programme on Earth Observation. The Global Land Service systematically produces a series of qualified bio-geophysical products on the status and evolution of the land surface, at global scale and at mid to low spatial resolution, complemented by the constitution of long term time series. The products are used to monitor the vegetation, the water cycle, the energy budget and the terrestrial cryosphere. | URL |
| Soil thickness, Regolith and Sedimentary Deposit Layers | National Aeronautics and Space Administration (NASA) | This data set provides high-resolution estimates of the thickness of the permeable layers above bedrock (soil, regolith, and sedimentary deposits) within a global 30-arcsecond (~1-km) grid using the best available data for topography, climate, and geology as input. These data are modeled to represent estimated thicknesses by landform type for the geological present. | URL |
| Global Hydrologic Soil Groups Based Runoff Modeling | National Aeronautics and Space Administration (NASA) | This data set represents a globally consistent, gridded data set of hydrologic soil groups (HSGs) with a geographical resolution of 1/480 decimal degrees, corresponding to a projected resolution of approximately 250-m. These data were developed to support USDA-based curve-number runoff modeling at regional and continental scales. Classification of HSGs was derived from soil texture classes and depth to bedrock provided by the Food and Agriculture Organization soilGrids250m system. | URL |
| Global Soil Erosion | European Soil Data Centre (ESDAC) | The Global Soil EROSION map at 25km resolution provides an assessment of global soil erosion for 2012 and 2001. 250m original data was used to resample at 25km. 202 countries are included with more than 125 millionKm2. The total soil loss has been estimated to 35 Pg yr-1 of soil eroded in 2001. The estimates are lower compared to past studies in 2012, 35.9 Pg yr-1 - Increase of 2.5% in soil erosion globally (due to land use change). | URL |
Water management
| The Surface Water Record | Dartmouth Flood Observatory, University of Colorado | This data set provides a comprehensive record of satellite-observed changes in the Earth's inland surface waters. The Surface Water Record can be used for Space Based Measurement, Mapping and Modeling of Surface Water. | URL |
| World Atlas of Large Flood Events | Dartmouth Flood Observatory, University of Colorado | This data set provides a global record of large discrete flood events since 1985. The Archive includes: 1) an online .html table of recent events, only; 2) Excel .xlsx and .xml files for all events, 1985-present, updated as the recent events html is updated; and 3) Zip-compressed GIS MapInfo format and .shp format files, each providing flood catalog numbers, centroids, area affected outlines, and other attribute information and updated as the recent events html is updated. | URL |
| World Water Quality Information | The United Nations Educational, Scientific and Cultural Organization (UNESCO) | Provides consistent and independent fresh water quality information at a global scale using remote sensing data. A global set of parameters in 90m spatial resolution is provided on a continental base. | URL |
Other
| Global Landslide hazard distribution | Center for Hazards and Risk Research (CHRR), Norwegian Geotechnical Institute (NGI) & Columbia University Center for International Earth Science and Information Network (CIESIN). | Global Landslide Hazard Distribution is a 2.5 by 2.5 minute grid of global landslide and snow avalanche hazards based upon work of the Norwegian Geotechnical Institute (NGI). The hazards mapping of NGI incorporates a range of data including slope, soil, soil moisture conditions, precipitation, seismicity, and temperature. Shuttle Radar Topography Mission (SRTM) elevation data at 30 seconds resolution are also incorporated. Hazards values 4 and below are considered negligible and only values 5 through 9 are utilized in further analyses. To ensure compatibility with other data sets, 1 is added to each of the values to provide a hazard ranking ranging 6 through 10 in increasing hazard. | URL |
| Global Landslide Catalog (GLC) | National Aeronautics and Space Administration (NASA) | This catalog identifies rainfall-triggered landslide events around the world, regardless of size, impacts or location. The GLC considers all types of mass movements triggered by rainfall, which have been reported in the media, disaster databases, scientific reports, or other sources. The GLC has been compiled since 2007 at NASA Goddard Space Flight Center. | URL |
| Global Fatal Landslides 2004 to 2016 | The University of Sheffield | This data set contains all non-seismically triggered fatal landslide events globally from 2004 to 2016. Systematic metadata search tools are used to identify relevant reports of landslide activity. Reports are corroborated and data updated by source triangulation using government and aid agency reports, academic papers and personal communications as new information becomes available. | URL |
| Global Pollution Map | Global Alliance on Health and Pollution (GAHP) | This data set contains spatial information on air pollution, contaminated sites and deaths caused by pollution. The coverage is global; however, there are many gaps to be filled as most of the data especially with air pollution is not available yet for most developing countries and contamination sites for developed countries. | URL |
| Global Land Surface Temperatures (LST) | National Aeronautics and Space Administration (NASA) & United States Geological Survey (USGS) | The data provides the temperature of the Earth's land surface during the daytime. The land surfaces include bare land, snow/ice cover, cropland, forest canopy and urban areas as observed by the MODIS satellite in clear sky conditions. | URL |
4. Application of land degradation information for disaster risk management
Once a comprehensive land degradation assessment has been made, the next steps would be to assess the impacts of such degradation in order to devise a plan of intervention and rehabilitation.
Identified land degradation hotspots can be used in combination with other data sets, such as rainfall events and soil profiles, to determine the risk of an area to experience landslides or mudflows and related disasters, and therefore plan to act as may be necessary to reduce such risk or prevent occurrence of a disaster.
This information can also be used to predict drought occurrences and food security situations given that land productivity is greatly hampered by the process of land degradation. This way, governments and other policy makers can make targeted reforms and strategies to address this issue.
Land degradation assessments can also help point out water scarcity and shortages, impending economic and social hardships/deprivations as well as health-related risks. Malnutrition, food and water-borne diseases and infections are related to land degradation either directly through food and water shortages or in complex pathways such as migration.
Degraded terrestrial ecosystems at the coasts can be identified and reinforced in order to provide protection against storm surges, coastal floods, tsunamis, further erosion of coastal features among other disasters.
Resilience planning for land-based systems also can benefit from land degradation assessments in order to identify at-risk areas and therefore develop relevant resilience strengthening strategies. Such system may include land use planning for cities, municipalities and even for rural areas. They can additionally be used to assess the economic and environmental sensitivities of the regions to land degradation and associated risks.
References
1. Alatorre, L. C., Beguería, S., Lana-Renault, N., Navas, A., & García-Ruiz, J. M. (2012). Soil erosion and sediment delivery in a mountain catchment under scenarios of land use change using a spatially distributed numerical model. Hydrology and Earth System Sciences, 16(5), 1321-1334.
2. Ali, A. M. S. (2007). September 2004 flood event in southwestern Bangladesh: a study of its nature, causes, and human perception and adjustments to a new hazard. Natural Hazards, 40(1), 89-111.
3. Bai, Z. G., & Dent, D. L. (2006). Global assessment of land degradation and improvement: pilot study in Kenya. ISRIC Report.
4. Bai, Z. G., Dent, D. L., Olsson, L., & Schaepman, M. E. (2008). Global assessment of land degradation and improvement: 1. identification by remote sensing (No. 5). ISRIC-World Soil Information.
5. Bai, Z. G., Dent, D. L., Olsson, L., & Schaepman, M. E. (2008a). Proxy global assessment of land degradation. Soil use and management, 24(3), 223-234.
6. Besseau, P., Graham, S., & Christophersen, T. (2018). Restoring forests and landscapes: the key to a sustainable future. Global Partnership on Forest and Landscape Restoration, Vienna, Austria. ISBN, (978-3), 902762-97.
7. Boix-Fayos, C., Calvo-Cases, A., Imeson, A. C., & Soriano-Soto, M. D. (2001). Influence of soil properties on the aggregation of some Mediterranean soils and the use of aggregate size and stability as land degradation indicators. Catena, 44(1), 47-67.
8. Brema, J., Rahul, T. S., & Julius, J. J. (2019). Study on Drought Monitoring Based on Spectral Indices in Noyyal River Sub-watershed Using Landsat-8 Imageries. In Proceedings of International Conference on Remote Sensing for Disaster Management (pp. 473-482). Springer, Cham.
9. de Jong, R., de Bruin, S., Schaepman, M., & Dent, D. (2011). Quantitative mapping of global land degradation using Earth observations. International Journal of Remote Sensing, 32(21), 6823-6853.
10. De Rosnay, P., Calvet, J. C., Kerr, Y., Wigneron, J. P., Lemaître, F., Escorihuela, M. J., ... & Coret, L. (2006). SMOSREX: A long term field campaign experiment for soil moisture and land surface processes remote sensing. Remote Sensing of Environment, 102(3-4), 377-389.
11. De Vente, J., & Poesen, J. (2005). Predicting soil erosion and sediment yield at the basin scale: scale issues and semi-quantitative models. Earth-science reviews, 71(1-2), 95-125.
12. de Vente, J., Poesen, J., Verstraeten, G., Van Rompaey, A., & Govers, G. (2008). Spatially distributed modelling of soil erosion and sediment yield at regional scales in Spain. Global and planetary change, 60(3-4), 393-415.
13. Dubovyk, O., Menz, G., Conrad, C., Kan, E., Machwitz, M., & Khamzina, A. (2013). Spatio-temporal analyses of cropland degradation in the irrigated lowlands of Uzbekistan using remote-sensing and logistic regression modeling. Environmental monitoring and assessment, 185(6), 4775-4790.
14. Dubovyk, O. (2017). The role of remote sensing in land degradation assessments: opportunities and challenges. European Journal of Remote Sensing, 50(1), 601-613.
15. Dumanski, J., & Pieri, C. (2000). Land quality indicators: research plan. Agriculture, Ecosystems & Environment, 81(2), 93-102.
16. Dwivedi, R. S. (2018). Geospatial Technologies for Land Degradation Assessment and Management. CRC Press.
17. Eckert, S., Hüsler, F., Liniger, H., & Hodel, E. (2015). Trend analysis of MODIS NDVI time series for detecting land degradation and regeneration in Mongolia. Journal of Arid Environments, 113, 16-28.
18. FAO, I. (2015). Status of the World’s Soil Resources (SWSR)–technical summary. Food and Agriculture Organization of the United Nations and Intergovernmental Technical Panel on Soils, Rome, Italy.
19. Gao, J., & Liu, Y. (2010). Determination of land degradation causes in Tongyu County, Northeast China via land cover change detection. International Journal of Applied Earth Observation and Geoinformation, 12(1), 9-16.
20. Gao, Z. H., Sun, B., & Li, Z. Y. (2016, May). Land degradation assessment by coupling npp and climate in Xilin gollegue, inner Monglia, China. In Proceedings of the 2nd Pan-Eurasian Experiment (PEEX) Conference and the 6th PEEX Meeting, Report Series in Aerosol Science (pp. 159-162).
21. Gichenje, H., & Godinho, S. (2018). Establishing a land degradation neutrality national baseline through trend analysis of GIMMS NDVI Time‐series. Land degradation & development, 29(9), 2985-2997.
22. Gisladottir, G., & Stocking, M. (2005). Land degradation control and its global environmental benefits. Land degradation & development, 16(2), 99-112.
23. Graw, V., Ghazaryan, G., Dall, K., Delgado Gómez, A., Abdel-Hamid, A., Jordaan, A., ... & Dubovyk, O. (2017). Drought dynamics and vegetation productivity in different land management systems of Eastern Cape, South Africa—A remote sensing perspective. Sustainability, 9(10), 1728.
24. Hermans-Neumann, K., Priess, J., & Herold, M. (2017). Human migration, climate variability, and land degradation: hotspots of socio-ecological pressure in Ethiopia. Regional Environmental Change, 17(5), 1479-1492.
25. Hu, Y., Zhen, L., & Zhuang, D. (2019). Assessment of Land-Use and Land-Cover Change in Guangxi, China. Scientific reports, 9(1), 2189.
26. Ibrahim, Y., Balzter, H., Kaduk, J., & Tucker, C. (2015). Land degradation assessment using residual trend analysis of GIMMS NDVI3g, soil moisture and rainfall in Sub-Saharan West Africa from 1982 to 2012. Remote Sensing, 7(5), 5471-5494.
27. Intergovernmental Science-Policy Platform on Biodiversity and Ecosystem Services (2018). Worsening Worldwide Land Degradation Now ‘Critical’, Undermining Well-Being of 3.2 Billion People. Media Release 23 March 2018. Retrieved from https://www.ipbes.net/news/media-release-worsening-worldwide-land-degradation-now-%E2%80%98critical%E2%80%99-undermining-well-being-32
28. Jain, M. K., & Das, D. (2010). Estimation of sediment yield and areas of soil erosion and deposition for watershed prioritization using GIS and remote sensing. Water Resources Management, 24(10), 2091-2112.
29. Kerr, Y. H. (2007). Soil moisture from space: Where are we?. Hydrogeology journal, 15(1), 117-120.
30. Lanfredi, M., Lasaponara, R., Simoniello, T., Cuomo, V., & Macchiato, M. (2003). Multiresolution spatial characterization of land degradation phenomena in southern Italy from 1985 to 1999 using NOAA‐AVHRR NDVI data. Geophysical Research Letters, 30(2).
31. Lanfredi, M., Coppola, R., Simoniello, T., Coluzzi, R., D'Emilio, M., Imbrenda, V., & Macchiato, M. (2015). Early identification of land degradation hotspots in complex bio-geographic regions. Remote Sensing, 7(6), 8154-8179.
32. Le, Q. B., Nkonya, E., & Mirzabaev, A. (2016). Biomass productivity-based mapping of global land degradation hotspots. Economics of land degradation and improvement–A global assessment for sustainable development, 55.
33. Li, Z., Deng, X., Yin, F., & Yang, C. (2015). Analysis of climate and land use changes impacts on land degradation in the North China Plain. Advances in Meteorology, 2015.
34. Lu, D., & Weng, Q. (2007). A survey of image classification methods and techniques for improving classification performance. International journal of Remote sensing, 28(5), 823-870.
35. Metternicht, G., Zinck, J. A., Blanco, P. D., & del Valle, H. F. (2010). Remote sensing of land degradation: Experiences from Latin America and the Caribbean. Journal of environmental quality, 39(1), 42-61.
36. Mekonnen, Z., Berie, H. T., Woldeamanuel, T., Asfaw, Z., & Kassa, H. (2018). Land use and land cover changes and the link to land degradation in Arsi Negele district, Central Rift Valley, Ethiopia. Remote Sensing Applications: Society and Environment, 12, 1-9.
37. Mirzabaev, A., Nkonya, E., Goedecke, J., Johnson, T., & Anderson, W. (2016). Global drivers of land degradation and improvement. In Economics of Land Degradation and Improvement–A Global Assessment for Sustainable Development (pp. 167-195). Springer, Cham.
38. Moges, D. M., & Bhat, H. G. (2018). An insight into land use and land cover changes and their impacts in Rib watershed, north‐western highland Ethiopia. Land degradation & development, 29(10), 3317-3330.
39. Nachtergaele, F., Petri, M., Biancalani, R., Van Lynden, G., Van Velthuizen, H., & Bloise, M. (2010). Global land degradation information system (GLADIS). Beta version. An information database for land degradation assessment at global level. Land degradation assessment in drylands technical report, 17.
40. Nachtergaele, F., Petri, M., & Biancalani, R. (2011). Land degradation. SOLAW background thematic report, 3.
41. Naseer, A., & Pandey, P. (2018). Assessment and monitoring of land degradation using geospatial technology in Bathinda district, Punjab, India. Solid Earth, 9(1), 75.
42. Nkonya, E., Gerber, N., Baumgartner, P., von Braun, J., De Pinto, A., Graw, V., ... & Walter, T. (2011). The economics of desertification, land degradation, and drought toward an integrated global assessment. ZEF‐Discussion Papers on Development Policy, (150).
43. Nkonya, E., Mirzabaev, A., & von Braun, J. (2016). Economics of land degradation and improvement: an introduction and overview. In Economics of land degradation and improvement–a global assessment for sustainable development (pp. 1-14). Springer, Cham.
44. Omuto, C. T., Vargas, R. R., Alim, M. S., Ismail, A., Osman, A., & Iman, H. M. (2009). Land degradation assessment and a monitoring framework in Somalia. FAO-SWALIM Technical Report L-14, Nairobi, Kenya.
45. Omuto, C., Vargas, R. R., & Paron, P. (2009a). Soil erosion and sedimentation modelling and monitoring of the areas between rivers juba and Shabelle in southern Somalia. Somalia Water and Land Information Management.
46. Ravi, S., Breshears, D. D., Huxman, T. E., & D'Odorico, P. (2010). Land degradation in drylands: Interactions among hydrologic–aeolian erosion and vegetation dynamics. Geomorphology, 116(3-4), 236-245.
47. Riva, M. J., Daliakopoulos, I. N., Eckert, S., Hodel, E., & Liniger, H. (2017). Assessment of land degradation in Mediterranean forests and grazing lands using a landscape unit approach and the normalized difference vegetation index. Applied geography, 86, 8-21.
48. Scholes, R. J., & Biggs, R. (2005). A biodiversity intactness index. Nature, 434(7029), 45.
49. Sonneveld, B. G. J. S., Keyzer, M. A., & Ndiaye, D. (2016). Quantifying the impact of land degradation on crop production: the case of Senegal. Solid Earth, 7(1), 93-103.
50. Stockholm Environment Institute. 2018) Land degradation worsening climate change and undermining well-being of billions. Feature Article retrieved from https://www.sei.org/featured/ipbes-land-degradation/
51. Sutton, P. C., Anderson, S. J., Costanza, R., & Kubiszewski, I. (2016). The ecological economics of land degradation: Impacts on ecosystem service values. Ecological Economics, 129, 182-192.
52. Taelman, S. E., Schaubroeck, T., De Meester, S., Boone, L., & Dewulf, J. (2016). Accounting for land use in life cycle assessment: the value of NPP as a proxy indicator to assess land use impacts on ecosystems. Science of the Total Environment, 550, 143-156.
53. Tagore, G. S., Bairagi, G. D., Sharma, N. K., Sharma, R., Bhelawe, S., & Verma, P. K. (2012). Mapping of degraded lands using remote sensing and GIS techniques. Journal of Agricultural Physics, 12(1), 29-36.
54. Tanser, F. C., & Palmer, A. R. (1999). The application of a remotely-sensed diversity index to monitor degradation patterns in a semi-arid, heterogeneous, South African landscape. Journal of arid environments, 43(4), 477-484.
55. Thiam, A. K. (2003). The causes and spatial pattern of land degradation risk in southern Mauritania using multitemporal AVHRR‐NDVI imagery and field data. Land Degradation & Development, 14(1), 133-142.
56. Toensmeier, E. (2016). The carbon farming solution: a global toolkit of perennial crops and regenerative agriculture practices for climate change mitigation and food security. Chelsea Green Publishing.
57. Torrion, J. A. (2002, February). Land degradation detection, mapping and monitoring in the Lake Naivasha Basin, Kenya. ITC.
58. Tun, K. K., Shrestha, R. P., & Datta, A. (2015). Assessment of land degradation and its impact on crop production in the Dry Zone of Myanmar. International Journal of Sustainable Development & World Ecology, 22(6), 533-544.
59. UNCCD. (1994). Elaboration Of An International Convention To Combat Desertification In Countries Experiencing Serious Drought And/Or Desertification, Particularly In Africa; Final Text of the convention. Retrieved from https://observatoriop10.cepal.org/sites/default/files/documents/treaties/unccd_eng.pdf
60. UNCCD. (2014). Land in Numbers 2019: Risks and Opportunities. Report retrieved from http://catalogue.unccd.int/1202-Land%20in%20numbers_2%20new-web.pdf
61. UNCCD. (2018). A Rising Africa in a Fragile Environment: The Initiative on Sustainability, Stability and Security. Publication retrieved from https://www.unccd.int/sites/default/files/documents/2018-07/3S_brochure_%20ENG%20-web.pdf
62. UNCCD. (2019). Land-Based Adaptation and Resilience: Powered By Nature. Report retrieved from https://www.eld-initiative.org/fileadmin/pdf/Land_Based_Adaptation_ENG_Sall_web.pdf
63. UNDP. (2017). Land Degradation and Migration: Will restoring the land keep people at home? News Article retrieved from https://www.undp.org/content/undp/en/home/blog/2017/6/16/Land-degradation-and-Migration-will-restoring-degraded-lands-keep-people-at-home-.html
64. Vargas, R. R., Omuto, C. T., & Njeru, L. (2007). Land degradation assessment of a selected study area in Somaliland: the application of LADA-WOCAT approach. SWALIM L-10 Land Degradation Report.
65. Vicente-Serrano, S., Cabello, D., Tomás-Burguera, M., Martín-Hernández, N., Beguería, S., Azorin-Molina, C., & Kenawy, A. (2015). Drought variability and land degradation in semiarid regions: Assessment using remote sensing data and drought indices (1982–2011). Remote Sensing, 7(4), 4391-4423.
66. Vieira, R. D. S. P., Tomasella, J., Alvalá, R. C. S., Sestini, M. F., Affonso, A. G., Rodriguez, D. A., ... & De Oliveira, S. B. P. (2015). Identifying areas susceptible to desertification in the Brazilian northeast. Solid Earth, 6(1), 347-360.
67. Wessels, K. J., Prince, S. D., Frost, P. E., & Van Zyl, D. (2004). Assessing the effects of human-induced land degradation in the former homelands of northern South Africa with a 1 km AVHRR NDVI time-series. Remote Sensing of Environment, 91(1), 47-67.
68. Wilkie, I., Heindorf, I., Curtin, F., & Wandel, A. (2017). Combating Desertification and Land Degradation: The World’s Best Policies. World Future Council Foundation. Report retrieved from https://www.worldfuturecouncil.org/wp-content/uploads/2017/08/FPA-Brochure-2017_e.pdf
69. Yengoh, G. T., Dent, D., Olsson, L., Tengberg, A. E., & Tucker III, C. J. (2015). Use of the Normalized Difference Vegetation Index (NDVI) to Assess Land Degradation at Multiple Scales: Current Status, Future Trends, and Practical Considerations. Springer.
70. Yengoh, G. T., Dent, D., Olsson, L., Tengberg, A. E., & Tucker, C. J. (2015a). Applications of NDVI for land degradation assessment. In Use of the normalized difference vegetation index (NDVI) to assess land degradation at multiple scales(pp. 17-25). Springer, Cham.
71. Yengoh, G. T., Olsson, L., Tengberg, A. E., Gonzalez-Roglich, M., Zvoleff, A., & Noon, M. (2018). Assessing Land Degradation to Support Sustainable Development; GEF-Land Degradation Monitoring Project Guidance. Arlington, United States. Report retrieved from; http://vitalsigns.org/sites/default/files/CI_GEF_Guidance%20ENG_C1_R1_PRINT%20%281%29.pdf
72. Zoungrana, B. J., Conrad, C., Thiel, M., Amekudzi, L. K., & Da, E. D. (2018). MODIS NDVI trends and fractional land cover change for improved assessments of vegetation degradation in Burkina Faso, West Africa. Journal of Arid Environments, 153, 66-75.