

1. Overview
Desert locust is the world’s most dangerous and destructive migratory pest (Cressman et al., 2016; Lazar et al., 2016). They are highly voracious, as a single adult locust can consume vegetation equivalent to its own weight (approximately 2 grams) in a day (Latchininsky et al., 2016). Locust swarms are highly mobile and can fly across continents and destroy entire livelihoods in less than six hours, with adult swarms flying about 150km daily. A small (1km2) size swarm (approx. 40 million locusts) can demolish the equivalent amount food that 35,000 people would eat in a day (Cressman et al., 2016). During the plague in 2003-2005 in West Africa, 100, 90 and 85 per cent losses on cereals, legumes and pastures respectively were recorded, affecting more that 8 million people (Renier et al., 2015; Brader et al., 2006). Due to desert locusts’ trans-boundary nature they require trans-boundary coordination and intervention to deal with.
Desert locust impact
-
Livelihoods/Food security and nutrition: Desert locust affect food security by destroying crops, thus affecting availability of food for human populations. They also feed on grasses and other wild vegetation affecting livestock and wild animals (Escorihuela et al., 2018).
-
Economic development: Global trade on agricultural commodities suffers a great deal due to the destruction of crops. Additionally, locust outbreak response and control is costly as millions of liters of pesticides have to be bought, and the necessary equipment and labor acquired. Further, recovering from the destructive impact of locust attacks puts a huge economic burden on the affected farmers and countries (Escorihuela et al., 2018; Cressman et al., 2016; Lazar et al., 2016). Locust emergency costs West Africa 3.3 million USD a year; in 2003-2005, however, 570 million USD was needed to combat the West and North Africa plague, an equivalent of 170 years of emergency response costs for the region (Escorihuela et al., 2018 Cressman et al., 2016).
-
Environment: Locust control quite often results in many environment-related side effects due to high use of pesticides and other chemicals (Lazar et al., 2016). Many times, it is difficult to discriminate between the locust swarms and other non-harmful organisms and vegetation, raising the cost of collateral damage to the environment. Further, the possibility of human intoxication by the chemical pesticides used is always looming (Brader et al., 2006).
Locust facts
-
Locust plagues take over a year to materialize. Stages of plague development outlined by Cressman (2013) as below:
-
Stage 1: Outbreak. Small and localized, can affect the size of a small town, consists of dispersed populations
-
Stage 2: Upsurge. Large increase in locust numbers, usually 2-3 successive transient breeding seasons, can affect the size of a country
-
Stage 3: Plague. Widespread (intraregional) and heavy infestation of locust bands and swarms after a year of good rains and uncontrolled upsurges, can affect the size of a continent
-
-
Early detection is critical in locust management - in the solitarious (lonesome) phase before they gregarize (form swarms) - because they posses very high mobility in the latter state; it is difficult to control mass migrating insects (Lockwood, 2015).
-
Locust infestation does have a beneficial effect to agriculture as the organic residue after their passing is a valuable source of fertilizer. However, this advantage can only be utilized if the farmer survives the economic and physical devastation caused by these swarming insect. Additionally, the protein and lipid in the locust body is considered highly nutritious by some nomadic communities (Lockwood, 2015).
Locust Management Constraints
-
Predicting: Locust population interactions, direction of movement and scale of displacement, and the predictability of seasonal rainfall are all complex and thus make for a challenging processes (Adriaansen et al., 2015). Populations may remain undetected for many months especially in the 16 million km2 recession/ breeding areas (Dinku et al., 2010; Brader et al., 2006).
-
Targeting and controlling outbreaks: There is no best agreed-on tactic for controlling locust outbreaks; some argue that waiting until later stages of gregarization is efficient because at this stage the swarms occupy less land area than the hoppers in solitarious or early gregarization phases (Cressman, 2005). On the other hand, such delay in action may be costly especially if the affected region does not have the capacity to respond fast over extensive areas of invasion (Brader et al., 2006).
-
Sociopolitical factors: The issue sometimes calls for cross border management; and locusts are considered beneficial to some communities as a source of food, fertilizer and nutrients (Lockwood, 2015).
2. Space technology for locust monitoring
How?
-
Monitoring of breeding and swarming areas: Rainfall monitoring
-
Forecasting to prevent upsurge/invasion: National locust survey reports, satellite imagery and meteorological data are used to create short- and medium-term forecasts of potentially locust favorable areas
-
Monitoring environmental conditions that might be conducive for locust reproduction and/or invasion: Very green vegetation, sporadic and localized rains
-
Mapping of spatial locust distribution over affected regions to inform control operations
Tools
-
Soil moisture products – can predict locust presence 2-3 months prior
-
Can be used to explain absence or presence of (desert) locust combined with (desert) locust biology
-
-
Vegetation indices – can only predict locust presence 1 month prior
Existing practices
1. eLocust3
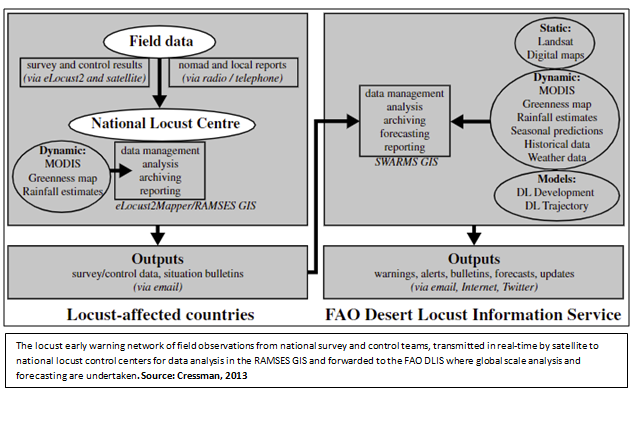
eLocust3 is recording and transmission system for locust data, consisting of a tablet and custom software to collect data and transmit it via satellite in real time to ground monitoring centers. It has a satellite image viewing and navigation feature that helps with location pinpointing. The data transmitted is the basis for all early warning, forecasting and prevention efforts by relevant authorities on the ground.
Some of the data collected include locust type, vegetation species, habitat type and treatment and safety precautions during control. After transmission to the locust control center, the data is used in combination with rainfall and green vegetation data from satellite imagery, historical records or other data sources and locust development and trajectory models to analyze the spread of the pest. These analyses are done in the RAMSES and SWARMS GIS platforms.
Reconnaissance and Monitoring System of the Environment of Schistocerca (RAMSESv4 (2015)
This is a custom GIS platform developed by FAO to be used by locust affected countries to analyze and manage locust, ecology, satellite imagery and other data (data received from the eLocust3 system). It is fitted with a database and GIS for this purpose. It uses open source GIS software OpenJump and PostGISPostgresSQL spatial database. National locust teams can use the system to create locust distribution maps that can be used to inform intervention strategies. The system is also used to transmit the data to the FAO headquarters for more analysis and storage.
Schistocerca Warning and Management System (SWARMS)
While RAMSES is useful for local/national locust monitoring SWARMS is a platform used to integrate, overlay, display, compare and map all relevant datasets for locust forecasting at the international level. Both vector data, such as roads and administrative boundaries, and raster data, such as MODIS imagery and rainfall estimates, are combined to help better understand the spatial relationship between infestations and the local environment (Cressman, 2013). SWARMS holds historical data since 1929 to date.
Overview of the locust early warning network (eLocust)
2. Soil Moisture for dEsert Locust early Survey (SMELLS)
SMELLS uses Sentinel – 1 SAR data with SMOS soil moisture to devise a moisture indicator tool for desert locust forecasting and prevention. Soil moisture is an excellent indicator of the reproduction potential of a given area. Additionally, soil moisture information precedes vegetation information, and thus can provide timely and actionable details to enhance prevention measures, usually 2-3 months prior, whereas vegetation information can only be used to get 1 month lead time. Locust occurrence is common in areas with soil moisture between the range of 0.10 – 0.20 m3/m3 . Click here for more details.
3. P- Locust – coming soon!
This is a geospatial decision support model using locust development, gregarization and biotope variables to determine locust presence and location in a timely manner. This tool is set to employ the use of satellite data such as Landsat 8, MODIS, Sentinel, SRTM, CHIRPS and ASTER, among others. The tool is currently under development by SERVIR/NASA together with other regional partners. Click here for more details.
 4. SUPARCO DisasterWatch Desert Locust Situation Alert
The Space Application Centre for Response in Emergency and Disasters (SACRED) of the Space & Upper Atmosphere Research Commission of Pakistan (SUPARCO), a UN-SPIDER Regional Support Office, is using space-based information to analyze areas with regards to their suitability as desert locust habitats. The maps resulting from this analysis indicate the suitability of habitat on a scale consisting of five values: least, less, normal, moderate and most. The maps are published online for download, and a related layer is produced and made available through the DisasterWatch Desert Locust Situation Alert geoviewer.
Space data
|
Dataset Name |
Provider |
Description |
Data Source |
|---|---|---|---|
|
Sentinel – 1 SAR |
European Space Agency (ESA) |
The Sentinel-1 mission provides data for monitoring water, soil, agriculture among other objectives. This data is used in combination with soil moisture data and other locust relevant ancillary data to create valid indicators for locust monitoring and mapping. Soon, information from Sentinel-3 will be integrated for long term forecasting. |
https://sentinel.esa.int/web/sentinel/missions/sentinel-1/data-products |
|
MODIS |
National Aeronautics and Space Administration (NASA) & United States Geological Survey (USGS) |
MODIS land data products are used to monitor land processes such as vegetation cover and condition as well as surface temperatures |
|
|
SMOS |
European Space Agency (ESA) |
Provides information on soil moisture over land for hydrology and vegetation monitoring among other uses. The soil moisture data may be retrieved from brightness temperature observations. |
|
|
SPOT4-VEGETATION |
Centre National d'Etudes Spatiales (CNES) & Vito (distributor) |
Provides information on vegetation greenness, percentage of vegetation cover and moisture content. Images are synthesized on a 10-day basis and made available for locust monitoring. |
https://www.vito-eodata.be/PDF/portal/Application.html#Browse;Root=2;Time=NORMAL,NORMAL,-1,,,-1,, |
|
METEOSAT-8 (MSG-1) |
European Organization for the Exploitation of Meteorological Satellites (EUMETSAT) |
At a spatial resolution of 3x3 km and 15 days temporal resolution, these images provide information about cloud cover which could be related to rainfall. Cumulative rainfall maps are an example of products of this method, which is commonly known as Cold Cloud Duration. |
Ancillary data
In situ soil moisture data
Local/ground locust surveys
Geo referenced Rainfall data (Dekadal Rainfall Estimates)
Other useful resources
UN FAO-DLIS (Desert Locust Information Service)
Commission for controlling the Desert locust in Northwest Africa
Commission for controlling the Desert Locust in the Western Region
Commission for controlling the Desert Locust in the Central Region
Commission for controlling the Desert Locust in Southwest Asia
Other elements
Pesticide use can increase chances of locust invasion and at the same time can be used to control locust infestation. In both cases, it has a negative environmental implication.
Scattered solitaries locusts breed in winter, spring and summer. With heavy rainfall in a seasonal breeding ground, the locusts can gregarize (organize into large swarms) and cause a plague, unless controlled by drought, their migration to unfavorable habitat or use of pesticides (Adriaansen et al., 2016).
With climate change affecting habitats differently, it is not yet know how the desert locust will adapt, given that it is an agile insect known to have survived difficult conditions. Alterations to its normal behavior and physique are possible (Cressman, 2013).
References
- Adriaansen, C., Woodman, J., Deveson, E., & Drake, V. (2016). The Australian Plague Locust—Risk and Response. In J. F. Shroder, & R. Sivanpillai (Eds.), Biological and Environmental Hazards, Risks, and Disasters. (1 ed., pp. 67-86). Netherlands: Elsevier. https://doi.org/10.1016/B978-0-12-394847-2.00005-X
- Brader, L., Djibo, H., Faye, F. G., Ghaout, S., Lazar, M., Luzietoso, P. N., & Babah, M. O. (2006). Towards a more effective response to desert locusts and their impacts on food security, livelihoods and poverty. Multilateral evaluation of the 2003–05 Desert locust campaign. Food and Agriculture Organisation, Rome.
- Cressman, K. (1997). SWARMS: a geographic information system for desert locust forecasting. In New Strategies in locust control (pp. 27-35). Birkhäuser Basel.
- Cressman, K. (2013). Climate change and locusts in the WANA Region. In Climate change and food security in West Asia and North Africa (pp. 131-143). Springer, Dordrecht.
- Cressman, K. (2013). Role of remote sensing in desert locust early warning. Journal of Applied Remote Sensing, 7(1), 075098.
- Cressman, K., Van der Elstraeten, A., & Pedrick, C. (2016). eLocust3: An innovative tool for crop pest control.
- Dinku, T., Ceccato, P., Cressman, K., & Connor, S. J. (2010). Evaluating detection skills of satellite rainfall estimates over desert locust recession regions. Journal of Applied Meteorology and Climatology, 49(6), 1322-1332.
- Escorihuela, M. J., Merlin, O., Stefan, V., Moyano, G., Eweys, O. A., Zribi, M., ... & Ghaout, S. (2018). SMOS based high resolution soil moisture estimates for desert locust preventive management. Remote Sensing Applications: Society and Environment, 11, 140-150.
- Latchininsky, A., Piou, C., Franc, A., & Soti, V. (2016). Applications of remote sensing to locust management. In Land Surface Remote Sensing (pp. 263-293). Elsevier.
- Lazar, M., Piou, C., Doumandji‐Mitiche, B., & Lecoq, M. (2016). Importance of solitarious desert locust population dynamics: lessons from historical survey data in A lgeria. Entomologia Experimentalis et Applicata, 161(3), 168-180.
- Lockwood J.A. (2015). Locusts: An Introduction. In: Shroder, J. F. Biological and environmental hazards, risks, and disasters. Elsevier.
- Renier, C., Waldner, F., Jacques, D., Babah Ebbe, M., Cressman, K., & Defourny, P. (2015). A dynamic vegetation senescence indicator for near-real-time desert locust habitat monitoring with MODIS. Remote Sensing, 7(6), 7545-7570.