, processed by ESA.")
Space technologies and geospatial data can support governments in improving situational awareness and responding to the COVID-19 outbreak. Several institutions have published information products, such as web maps of confirmed infections and deaths, that are making use of the advantages of GIS. Others have used space technologies to track pollution levels across the world, highlighting a drop due to the restrictions imposed as a result of the pandemic. Yet others are using a combination of global navigation satellite systems technologies to map the position of critical infrastructure in geographical areas where there are reported cases.

The United Nations Office for Outer Space Affairs, through its UN-SPIDER programme, has created this COVID-19 emergency response overview page to facilitate the discovery of examples of contributions of space technologies to addressing COVID-19 that are being published by government agencies, international and regional organizations, academia, civil society and the private sector. To find out more about the efforts of UNOOSA in advancing the use of space-based solutions for global health, please visit this web page.
To support users in finding relevant content, the list below can be filtered by keywords as well as format of the resource. The list does not seek to be exhaustive, nor to recommend particular sources, but to provide a selection of examples of how space technologies and the space community support response efforts to COVID-19.
UNOOSA will host a webinar on Space4Health on 14 May at 10am and 4pm Vienna, Austria time (UTC+2).
If you are using space technologies for responding to the COVID-19 pandemic and would like your work to be included on this page, please use this form to submit details.

The Asian Development Bank (ADB) is calling for solutions to measure the short-term changes in economic activities brought about by COVID-19. ADB welcomes research that draws key patterns and insights into economic impacts of COVID-19 crisis, by making use of EO data of any applicable satellite images or any processing infrastructures.… Read more
Tag: Research opportunities
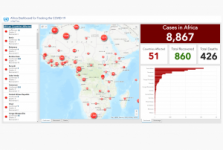
The dashboard provides an overview of cases, countries affected, total deaths and total recovered in Africa. It is maintained by the United Nations Economic Commission for Africa.
Tag: Situational data, UN activities
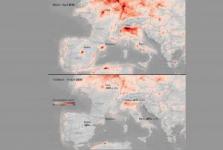
Further analyses are showing the continued low levels of nitrogen dioxide concentrations across Europe – coinciding with lockdown measures implemented to stop the spread of the coronavirus. New data from the Copernicus Sentinel-5P satellite, from the European Union Copernicus programme, show some cities seeing levels fall by 45—50%… Read more
Tag: (Indirect) impact of the virus

ESA launched on 31 March 2020 an Announcement of Opportunity (AO) inviting companies from ESA Member States to submit their ideas for deploying and demonstrating services to respond to the emergency that Europe, and especially Italy, is facing because of the spread of the coronavirus. The AO is issued in cooperation with the Italian Minister… Read more
Tag: Research opportunities
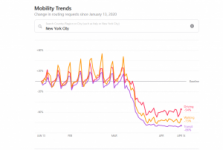
Apple has released a mobility data trends tool from Apple Maps to support mitigating the spread of COVID-19. Using aggregated data collected from Apple Maps, the new website indicates mobility trends for major cities and 63 countries or regions. The information is generated by counting the number of requests made to Apple Maps for… Read more
Tag: Emergency mapping, (Indirect) impact of the virus
Copernicus Climate Change Service (C3S*) has worked with environmental software experts B-Open to develop an application that allows health authorities and epidemiology centres to explore whether temperature and humidity affect the spread of the coronavirus. This application is freely accessible from the C3S Climate Data Store (CDS).
Tag: Situational data, Risk assessments

Big Earth Data is calling for paper submissions addressing the opportunities and challenges of big Earth data in public health research and practice. Big Earth Data welcomes contributions exploring the linkage between COVID-19 and environmental and public health, as well as the multiple impacts of human behavior changes on the Earth.
Tag: (Indirect) impact of the virus, Research opportunities
The Group of Earth Observations (GEO) Secretariat invites members of the GEO community to inform them of examples of work underway that use Earth observations in support of COVID-19 monitoring, response or recovery. Their aim is to share this information through the GEO website and other communications channels. They are also available to… Read more
Tag: Risk assessments, Emergency mapping, (Indirect) impact of the virus, Research opportunities
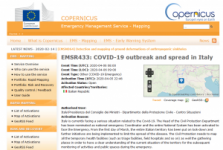
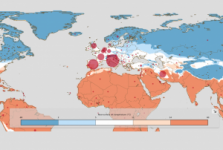
The Copernicus Emergency Management System - Mapping has been activated to support Italy in responding to the COVID-19 outbreak in the country. The Civil Protection Department needs to map all the temporary health facilities (such as triage facilities, field hospitals and so on) as well the gathering places in order to have a clear… Read more
Tag: Emergency mapping
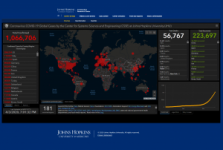
The Center for Systems Science and Engineering (CSSE) at Johns Hopkins University, Baltimore, MD, USA, developed an interactive dashboard to visualise and track reported cases of coronavirus disease 2019 (COVID-19) in real time. The dashboard shows the location and number of confirmed COVID-19 cases and deaths.
Tag: Situational data
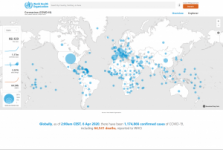
The WHO Coronavirus disease (COVID-19) Situation Dashboard provides an overview of confirmed cases and deaths, alongside the number of countries, areas or territories with cases. The dashboard allows displaying the number of cases by date of report as well as cumulative cases. The underlying data can be downloaded by clicking on "… Read more
, Map
Tag: Situational data, UN activities
Tag: Situational data