Guatemala City is surrounded by steep ravines which developed over millions of years due to erosion of the surface triggered by intense rainfall as well as due to landslides triggered by intense rainfall and earthquakes. Chinautla is one of the neighbouring municipal districts of the Greater Metropolitan Area of Guatemala City. During the 1976 earthquake, this and other municipal districts experienced many landslides triggered by the earthquake.
At the request of UN-SPIDER, the Geographic Information Systems Department of the Executive Secretariat of Guatemala’s National Coordinating Agency for Disaster Reduction (SE-CONRED) modelled the landslide hazard in the region of Chinautla using two digital elevation models (DEM):
- The DEM developed by the United States National Aeronautics and Space Administration (NASA) based on its Shuttle Radar Topography Mission (SRTM), and
- The WorldDEMTM developed by Airbus Defence and Space GmbH.
Table 1 presents the characteristics of these two digital elevation models:
| Parameter | WorldDEMTM | SRTM DSM |
|---|---|---|
| XY coordinate system | GCS WGS 1984 | GCS WGS 1984 |
| Vertical coordinate system | EGM2008 geiod height | EGM1996 geiod height |
| Resolution | 0.4 arc sec (approx. 12m) | 1 arc sec (approx. 30m) |
| Vertical accuracy | 2m (relative) / 4m (absolute) | 16m (with 90% confidence) |
| Data acquisition date | 2011 - 2015 | 2000 |
Both data sets are digital surface models (DSM), which represent the surface of the Earth including buildings, infrastructure and vegetation.
Figure 1 presents the geographic area where this analysis was conducted.
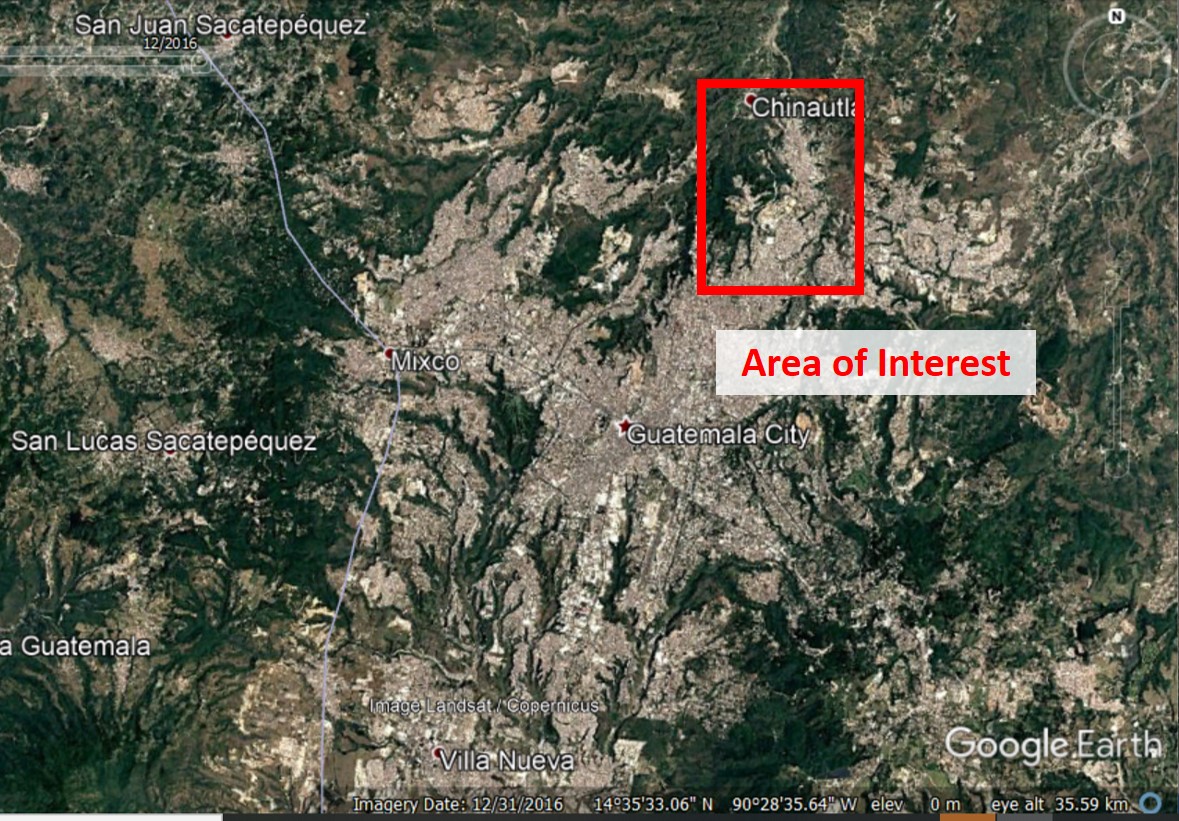
Figure 1: The Greater Metropolitan Area of Guatemala City and the area of interest in the Chinautla municipal district where the landslide hazard assessment was conducted.
This article presents the results of this analysis.
Data and model
For this landslide hazard assessment, the Mora-Vahrson procedure was used. This procedure is presented in figure 2. The procedure makes use of two types of components: an intrinsic landslide susceptibility and a triggering factor. The intrinsic landslide susceptibility is calculated using three factors:
- Lithology factor (Sl)
- Slope factor (Sr)
- Soil moisture factor (Sh)
The triggering factor is calculated using two additional factors:
- Seismic factor (Ts)
- Precipitation factor (Tp)
The landslide hazard assessment is calculated using the following equation:
H = (Sr*Sl*Sh) * (Ts + Tp)
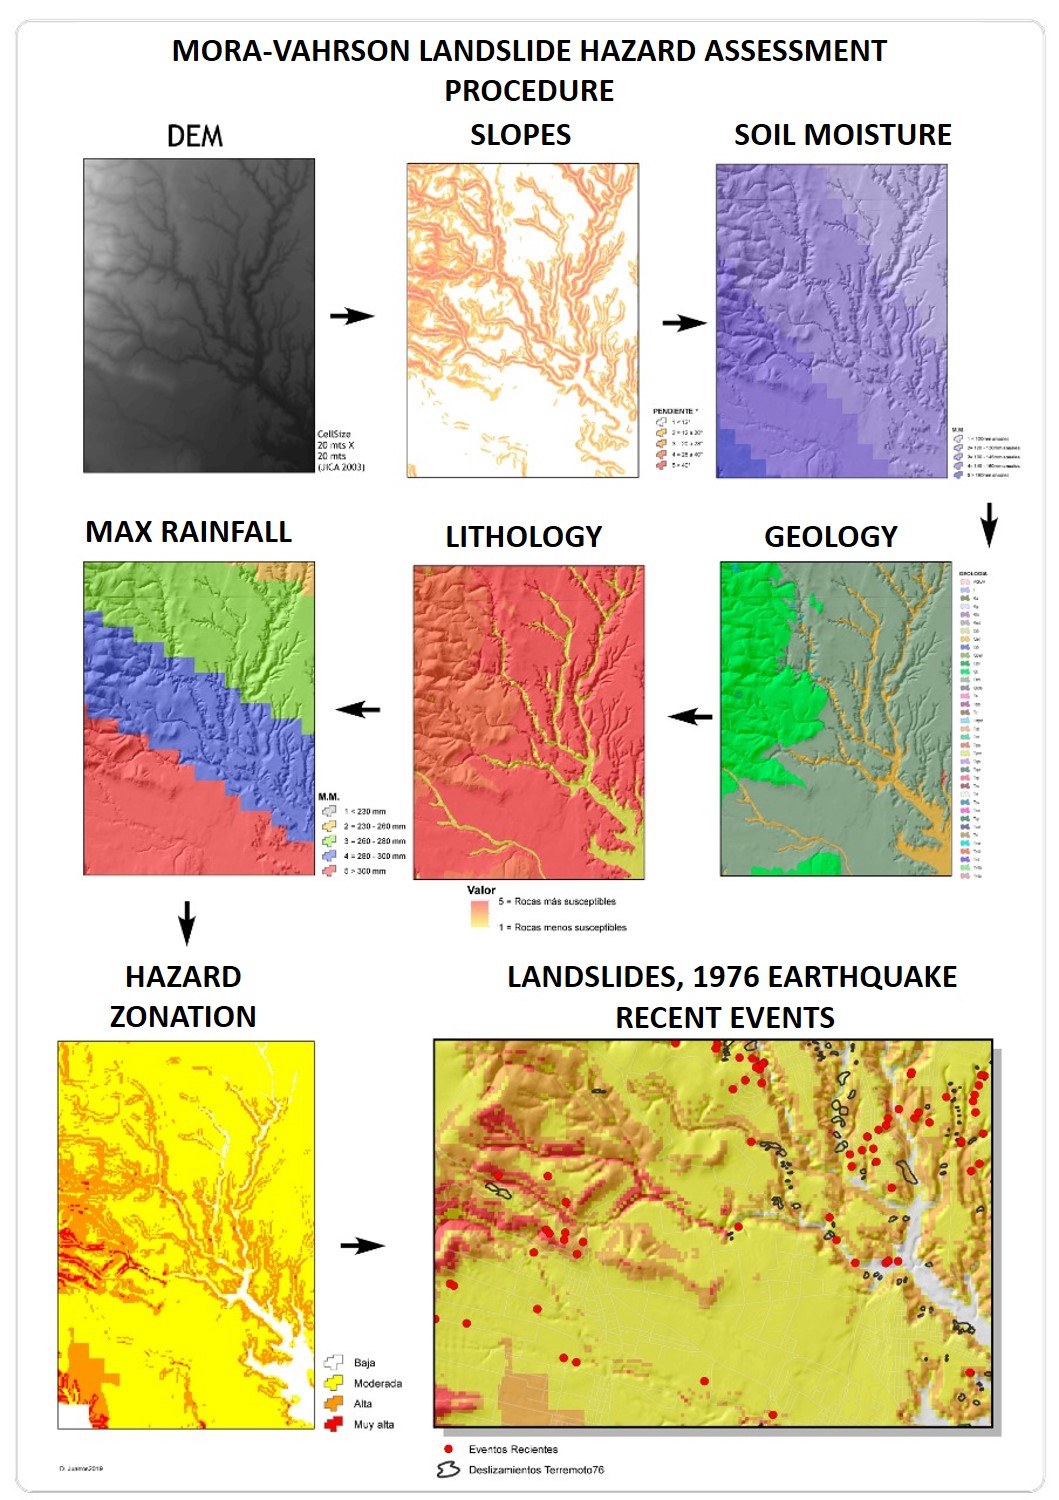
Figure 2: Mora-Vahrson procedure used for landslide hazard assessment. Source: SE-CONRED.
The required information has been extracted from different sources:
- Slope: The slope is extracted from the digital elevation models. Two models were employed in this comparison: the WorldDEMTM developed by Airbus Defence and Space GmbH, and the SRTM developed by NASA.
- Lithology: The information on the lithology for Chinautla region was extrated from the geological map of the central region of Guatemala, elaborated by the National Geographic Institute.
- Soil humidity: The geospatial data on soil humidity conditions was extracted from the study conducted by the Guatemalan Institute of Agriculture, Natural Resources and Environment of the Rafael Landivar University (IARNA – URL) on the bio-climatic classification of the country on the basis of the Holdridge model.
- Precipitation: Geospatial data on precipitation was extracted from the hydrological atlas of Guatemala elaborated by the National Institute for Seismology, Volcanology, Hydrology and Meteorology of Guatemala (INSIVUMEH)
- Seismic factor: Geospatial data on seismic hazard was extracted from an internal assessment of seismic hazard conducted at SE-CONRED.
The calculation of the landslide hazard assessment was conducted using a geographic information system.
Figure 3 presents the results of the comparative assessment. On the left, the results obtained using SRTM and on the right using WorldDEMTM of Airbus Defence and Space GmbH:
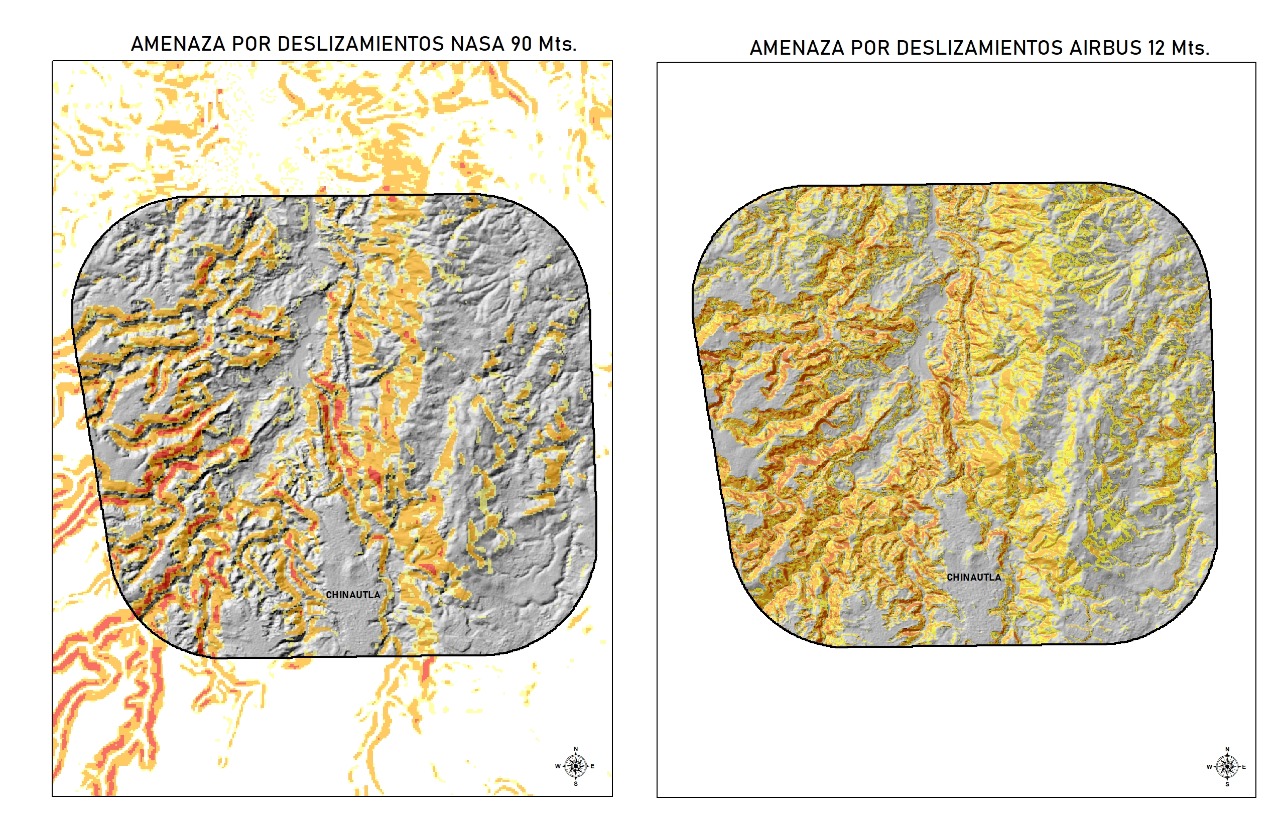
Figure 3: Comparison of landslide hazard maps extracted using the SRTM (left) and WorldDEMTM (right).
As can be seen, there is a general agreement using the two DEMs regarding areas exposed to landslides. However, the differences can be detected at a higher resolution. Figure 4a shows a close-up of the map developed using the SRTM while figure 4b shows a close-up of the map developed with the WorldDEMTM.
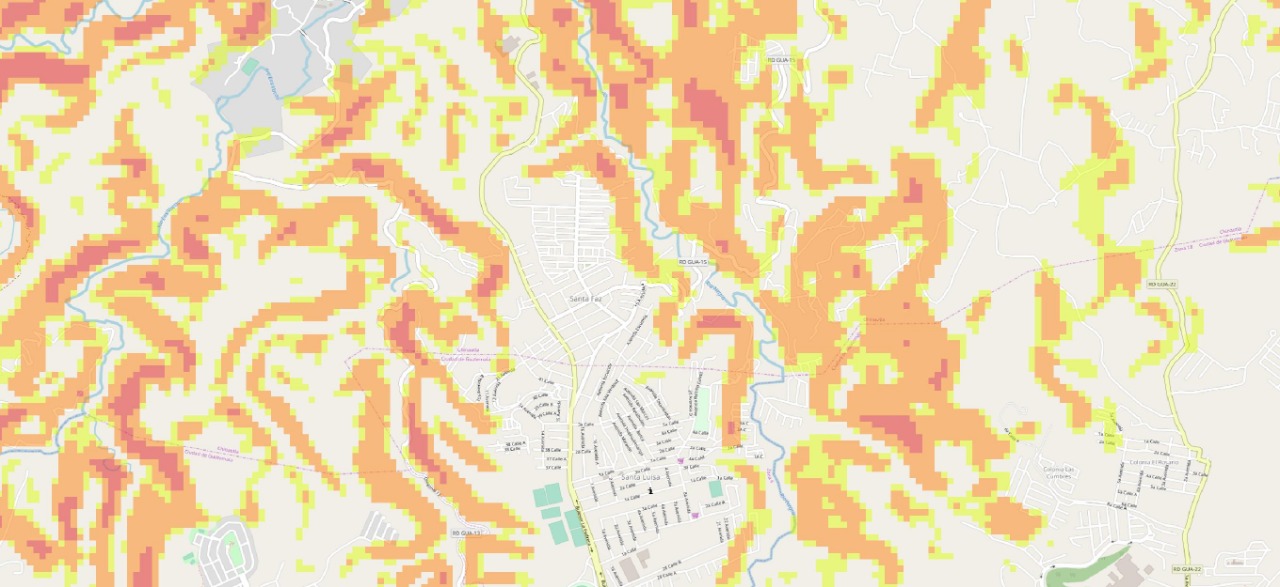
Figure 4a: Close-up of the map developed using the SRTM
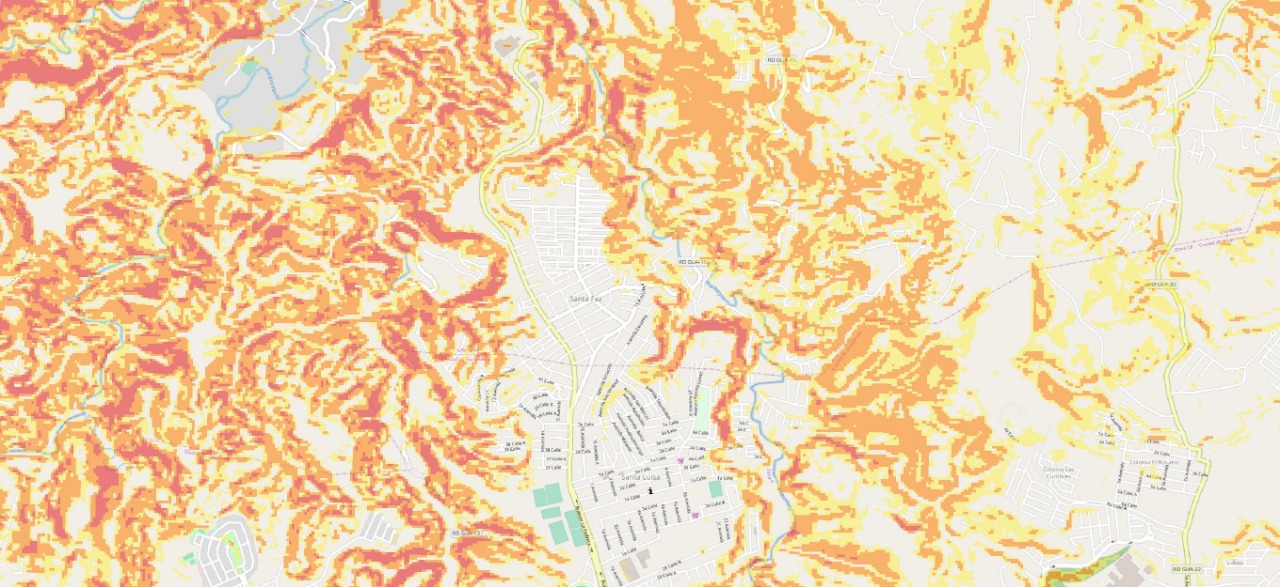
Figure 4a: Close-up of the map developed using the WorldDEMTM
Analysis
The comparison of the landslide hazard maps extracted with the two DEMS leads to the following results:
- Overall, landslide hazard areas are located in similar places when using the two DEMs.
- When using the SRTM, the geographical extent of areas classifed as low, medium and high hazard area is smaller than when using WorldDEMTM.
- The higher resolution of the hazard map developed using the WorldDEMTM allows for a more precise demarcation of areas classified as low, medium and high hazard.
The differences can be attributed to the higher resolution of the WorldDEMTM that allows for a more precise detection of small differences in elevation in the area of interest.
Comparing the landslide hazard map with the map of landslides triggered by the 1976 earthquake
On 4 February 1976, a strong 7.6 magnitude earthquake impacted large parts of the country, killing more than 23,000 inhabitants. The earthquake triggered a large number of landslides in the highlands of the country, as well as in many ravines in the Greater Metropolitan Area of Guatemala City. Figure 5 presents the location of several of those landslides near Chinautla and the landslide hazard map developed using the WorldDEMTM.
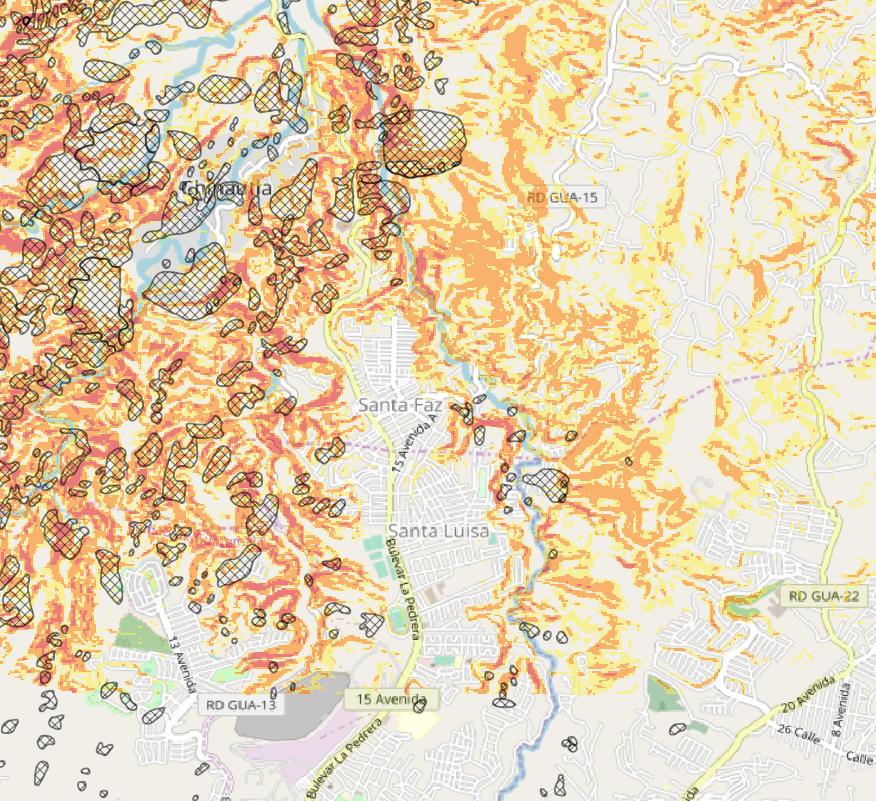
Figure 5: Location of landslides triggered by the 1976 earthquake (black polygons with a cross pattern) and the landslide hazard map developed using the WorldDEMTM.
In general, it can be stated that the majority of landslides that took place in 1976 coincide with those areas where the landslide hazard is high (red areas). Areas where the landslide hazard is moderate or low did not experience landslides.
Conclusions
The comparison of the results of the landslide modelling using WorldDEMTM and SRTM leads to the conclusion that the higher resolution of WorldDEMTM allows for the modelling of landslide hazard with a higher precision, identifing more precisely which areas may experience landslides triggered by rainfall or by earthquakes.
It is important to be aware of the different characteristics of WorldDEMTM and SRTM to be able to correctly evaluate the results. The main differences are:
- Acquisition dates: The acquisition period of WorldDEMTM is January 2011 to mid 2015 and thus the WorldDEMTM is more than 10 years more up-to-date than SRTM (SRTM acquisition time is February 2000).
- Accuracy: The vertical accuracy of WorldDEMTM with a global average of LE90ABS below 4 meters, which is much higher than SRTM (LE90ABS below 16m).
- Resolution: WorldDEMTM has a relative accuracy of less than 2 meters for slopes below 20 per cent; and less than 4 meters for slopes above 20 per cent.
The WorldDEM™ used in this analysis is a Digital Surface Model. However, to reduce the impact of surface features such as vegetation, digital terrain models (DTM) are usually preferred for the purpose of landslide modelling. Since 2019, Airbus Defence and Space GmbH offers a WorldDEM-based, global, automatically derived DTM product with a resolution of 24m.
Acknowledgements
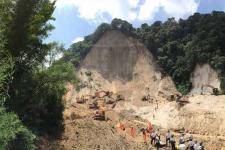
![]() This user story has been provided by Danilo Juarros of the Executive Secretariat of the National Coordinating Agency for Disaster Reduction of Guatemala (SE-CONRED). The first image of the article, courtesy of CONRED, shows the landslide in El Cambray II in the municipality of Santa Catarina Pinula in 2015.
This user story has been provided by Danilo Juarros of the Executive Secretariat of the National Coordinating Agency for Disaster Reduction of Guatemala (SE-CONRED). The first image of the article, courtesy of CONRED, shows the landslide in El Cambray II in the municipality of Santa Catarina Pinula in 2015.
The WorldDEMTM data has been provided by Airbus Defence and Space GmbH in the framework of the MOU between UNOOSA and Airbus Defence and Space.
References
- IARNA-URL (2011): Cambio climático y biodiversidad. Elementos para analizar sus interacciones en Guatemala con un enfoque ecosistémico. Serie técnica 35. Guatemala: Iarna-URL, 2011.
- IGN: Mapa geológico general de Guatemala [Mapa.] Hoja Guatemala ND 15-8-G / Printed by IGN.
- INSIVUMEH: Atlas Hidrológico: available at: http://www.insivumeh.gob.gt/hidrologia/ATLAS_HIDROMETEOROLOGICO/Atlas_hidro.htm
- S. Mora and W. G. Vahrson (1991). For more information and one application of this method, visit: https://webserver2.ineter.gob.ni/desliza/estudios/Mora_Vahrson.pdf
- NASA SRTM: https://www.earthdata.nasa.gov/data/instruments/srtm
- WorldDEMTMlite Technical Product Specification, Version 1.0, September 2019
- WorldDEMTM Technical Product Specification Document, Version 2.5, April 2019
- WorldDEMTM of Airbus Defence and Space Website: https://www.intelligence-airbusds.com/en/8703-worlddem