 in Honduras in 2020. Image: contains modified Copernicus Sentinel data (2020), processed by UN-SPIDER.")
Machine learning approaches provide new possibilities for flood detection as more data becomes available, computing power increases and machine learning algorithms improve. Machine learning has emerged as a preferred instrument to delve into non-linear systems and generated predictions of floods. In flood forecasting, traditional methods of predicting hazard variables can involve a chain of hydrologic and hydraulic models that describe the physical processes. Although such models provide system understanding, they often have high computational and data requirements. Machine learning methods have the potential to improve accuracy as well as reduce calculating time and model development cost.
Table of Contents
1.1 Classification of machine learning tasks
2. Limitations of Conventional Methods
3. Machine Learning for Flood Detection
3.1. Big Data for Flood Management
3.2. What is Currently Being Done?
3.2.1. Flood Detection and Mapping using EO Data
3.2.2. Flood Prediction and Modelling
3.3. Common Machine Learning Algorithms
3.3.1. Artificial Neural Networks (ANNs)
3.3.2. Adaptive Neuro-Fuzzy Inference System (ANFIS)
3.3.4. Ensemble Prediction Systems (EPSs)
3.3.5. Support Vector Machine (SVM)
1. What is machine learning?
Machine Learning (ML) is a field of Artificial intelligence (AI) used to recognise patterns automatically and intuitively in a dataset without being explicitly programmed. Thereby, providing an easier implementation of complex world problems with low computation cost, as well as fast training, validation, testing and evaluation, with high performance compared to physical models and relatively less complexity (Mosavi et al., 2018; Wagenaar et al., 2020). Figure 1 illustrates the basic steps required to build an ML model.

1.1. Classification of machine learning tasks
Most statistically learning problems fall into one of two categories:
1.1.1. Supervised Learning
Supervised learning can apply what has been learned in the past to new data using labelled examples to predict future events. In other words, the aim is to fit a model that relates the response to the predictors and to accurately predict the response for future observations (prediction) or better understand the relationship between the response and the predictors (inference). Starting from the analysis of a known training dataset, the learning algorithm produces an inferred function to make predictions about the output values (Casella et al., 2006). The system can provide targets for any new input after sufficient training. The learning algorithm can also compare its output with the correct, intended output and find errors to modify the model accordingly. Many classical statistical learning methods such as linear regression and logistic regression, as well as more modern approaches such as boosting and support vector machines, operate in the supervised learning domain. A learning algorithm based on provided input or features trains itself into a function(s) that could be further used to infer the output or labels. The training is done provided with the correct labels, so the algorithm adjusts itself with the tuning of hyperparameters which are most critical in controlling behaviour and correct prediction. The training stops when an acceptable performance level has been achieved (Liu & Wu, 2012).
1.1.2. Unsupervised Learning
In contrast, unsupervised learning describes a situation where for every observation there are predictors with no associated response value that can be used to supervise the analysis. In this setting, the model is somewhat working blind because no labels are given to the learning algorithm, leaving it on its own to find structure in its input. Unsupervised learning can be used to discover hidden patterns in data and understand the relationships between the variables or between the observations. One statistical learning tool that is often utilised is cluster analysis (Casella et al., 2006).
2. Limitations of Conventional Methods
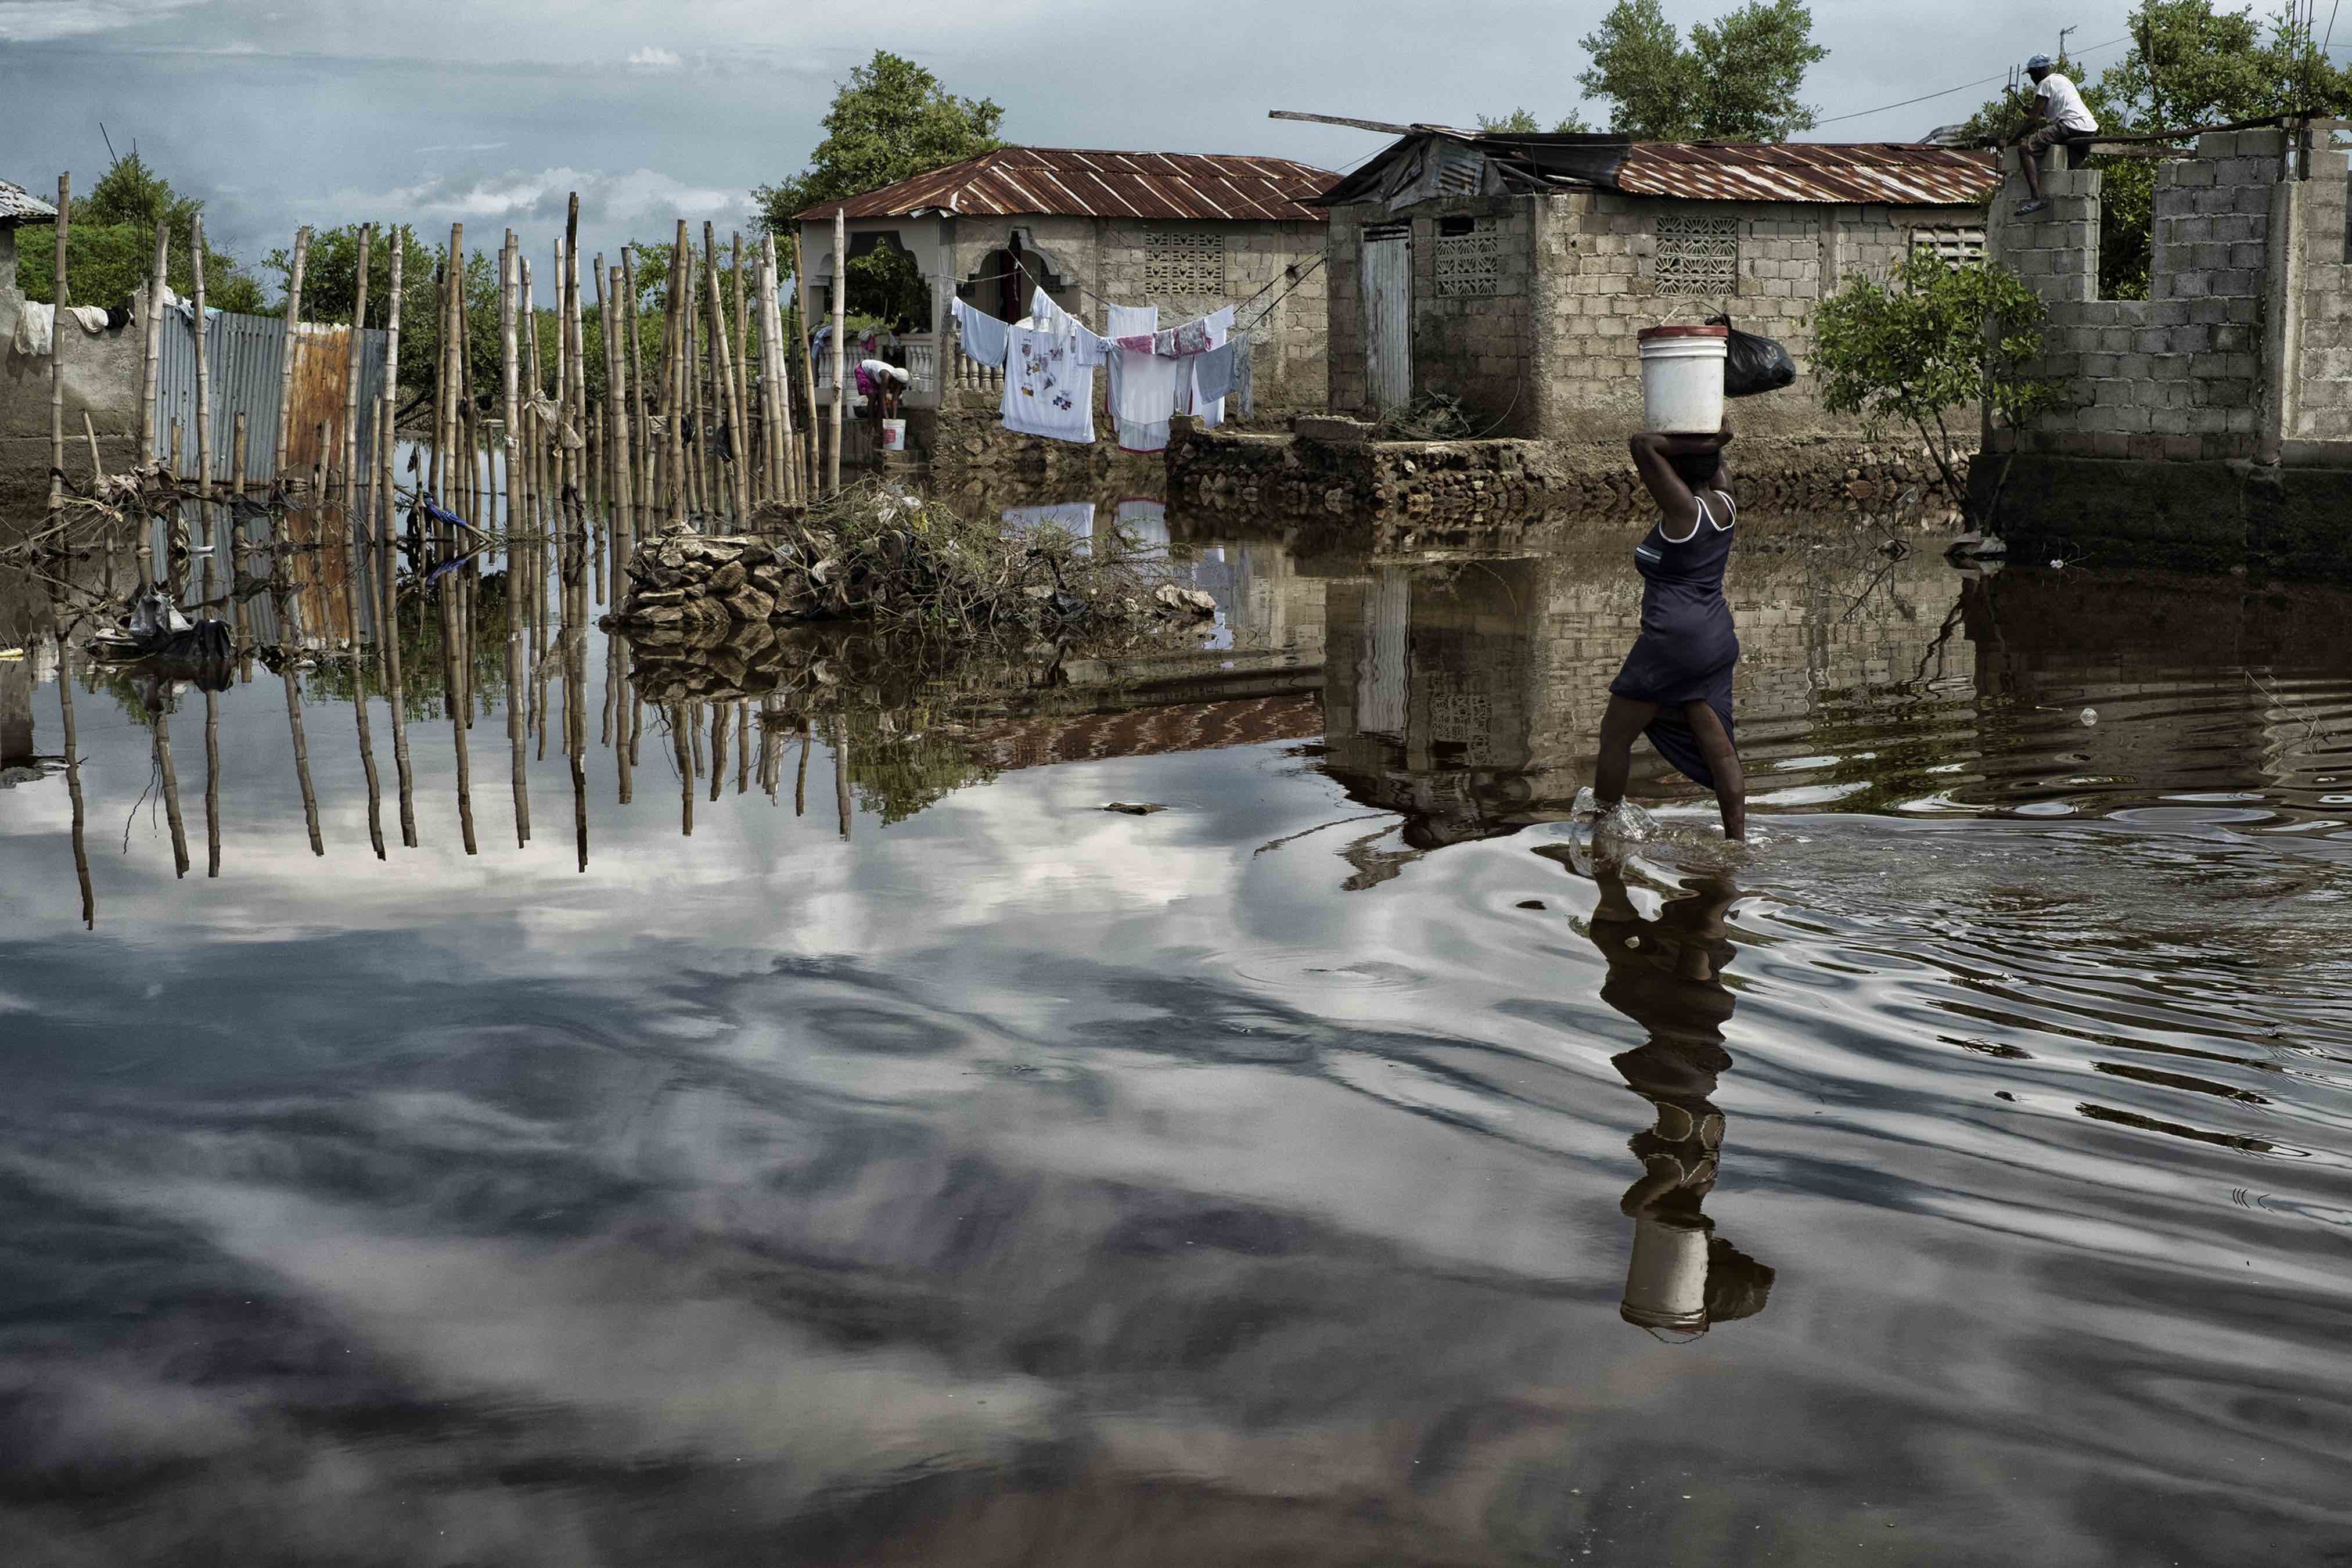
Floods are among the most destructive natural disasters and account for almost half of all weather-related disasters, affecting 2.3 billion people. Improved response to mitigate and manage flood risk can be greatly assisted by satellite observation, which can be used in the mitigation, response, and recovery stages of the disaster cycle (IPCC, 2012).
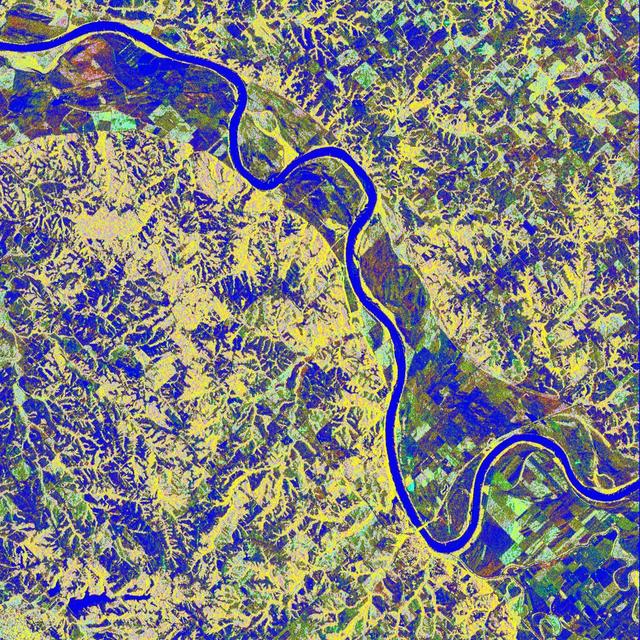
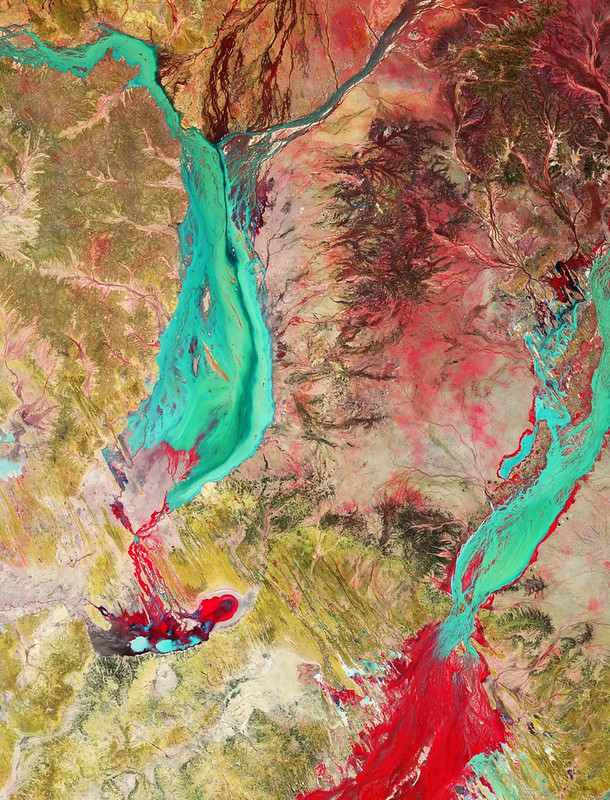
Conventional methods to map inundation use optical and radar satellite sensors at different spatial resolutions and temporal frequencies. Approaches such as the band thresholding, normalised differencing, complex combinations of SWIR with other bands, pixel-based detection of water absorption in the short-wave infrared spectrum (SWIR) are used to detect, map and monitor floods in optical images. MODIS (Moderate Resolution Imaging Spectrometer, 250m spatial resolution) exploit the highly absorptive capacities of water in the SWIR relative to other objects or use the near-infrared (NIR) spectrum relative to the visible spectrum. Thus, providing water detection at a daily time step globally. Medium resolution sensors such as Landsat and Sentinel-2 are often used to identify inundation using band thresholding, normalised differencing, or more complex combinations of SWIR and NIR with other bands. The major downside to using these techniques for flood detection is that they suffer from misclassifications of water and cloud shadows, which both have low reflectance values in SWIR and NIR (Bonafilia et al., 2020).
SAR (Synthetic Aperture Radar) sensors can be important for flood detection due to their ability to detect through clouds. SAR sensors such as Sentinel-1 have been used to map inundation by identifying water, which typically has lower backscatter values relative to other features (in VV, HH, VH, and HV bands)(Mosavi et al., 2018). Water is identified by thresholding backscatter values on a single image, the difference in backscatter between two images, or variance of backscatter in a time series. Inundated vegetation and flooding in urban areas may present an increase in backscatter during flood events due to a “double bounce” effect (Huang et al., 2018). Urban flood damage has been approximated using the loss of interferometric signal coherence (phase information) of SAR sensors between two time periods (Rubinato et al., 2019). Nearly all of these methods, however, rely on threshold to determine flood versus non-flood areas. More so, results derived from thresholding are often overestimated or underestimated flooded areas because there are no standard guidelines for determining threshold values, hence, is user-defined (Bonafilia et al., 2020).
Physically-based models have long been used to predict hydrological events, such as storm rainfall/runoff shallow water condition, hydraulic models of flow, and further global circulation phenomena, including the coupled effects of atmosphere, ocean, and floods. Although physical models show great capabilities for predicting a diverse range of flooding scenarios, they often require various types of hydro-geomorphological monitoring datasets, hence requiring intensive computation, which prohibits short-term prediction of floods. Furthermore, the development of physically-based models often requires in-depth knowledge and expertise regarding hydrological parameters and are not reliable due to inherent systematic errors (Mosavi et al., 2018).
3. Machine Learning for Flood Detection
Increasing amounts of data, together with more computing power and better ML algorithms to analyse the data are causing changes in almost every aspect of our lives. This trend is expected to continue as more data becomes available, computing power increases and ML algorithms improve. Flood risk and impact assessments are also being influenced by this trend, particularly in areas such as the development of mitigation measures, emergency response preparation, and flood recovery planning ( Lamovec et al., 2013; Bonafilia et al., 2020; Wagenaar et al., 2020).
With computational advancement and algorithms enhancements, ML has emerged as a preferred instrument to delve with non-linear systems and explore automatically generated predictions of floods. Computational algorithms such as neural networks have been majorly used to estimate flood in threatened areas of a river and its effect outside of the specific area. It is expected that in the future more applications become feasible and many process models and traditional observation methods will be replaced by ML. Examples of this include the use of ML on remote sensing data to estimate exposure or on social media data to improve flood response. Some improvements may require new data collection efforts, such as for the modelling of flood damages or defence failures (Zehra, 2020).
3.1. Big Data for Flood Management
Big data has evolved at an unbelievably fast pace. In the specific context of disaster resilience, big data can help in all four phases of disaster management: prevention, preparedness, response, and recovery. This impulse of new data combined with machine algorithms could lead to changes in flood risk and impact assessment (Wagenaar et al., 2020). Also, big data enables descriptive analytics (analysis of the current or past state of floods), predictive analytics (analytical assessment of long-term or a short-term forecast of floods), prescriptive and discursive analytics that addresses gaps in information flows in pre-disaster, response and post-disaster situations (Lamovec et al., 2013). The data from the emerging technologies including satellite imagery, aerial imagery and videos from unmanned aerial vehicles (UAVs), sensor web and Internet of things (IoT), airborne and terrestrial Light Detection and Ranging (LiDAR), simulation, spatial data, crowdsourcing, social media, and mobile GPS and Call Data Records (CDR) form the core of big data for flood and other disasters (Lee et al., 2012).
3.2. What is Currently Being Done?
To create a ML prediction model, the historical records of flood events, in addition to real-time cumulative data of several rain gauges or other sensing devices for various return periods, are often used. The sources of the dataset are traditionally rainfall and water level, measured either by ground rain gauges, or relatively new remote- sensing technologies such as satellites, multisensory systems, and/or radars (Seo & Kim, 2016).
3.2.1. Flood Detection and Mapping using EO Data
Veljanovski et al., 2011 conducted a comparison of pixel-based water delineation, object-based classification, and ML procedure. Application of ML procedure for the determination of flooded areas is different from the other 2 methods stated above because it uses a wider set of auxiliary data. Besides radar image and DEM derivatives (slope, heights), hydrology (distance from water streams) and land use data were used to model flooded areas. The ML approach proved to be successful in the detection of floods under the cornfields where radar waves do not penetrate through the crop down to the flooded grounds - where the other two methods failed.
In this study, the ML procedure was carried out through the following steps. Preparation of a meaningful set of training data: 300 training points were generated to represent the 25 × 20 km wide area. Each of these points was described by six attributes: pixel value of radar image (intensity), height, slope, distance from water (permanent rivers and streams), land use, and tag “flooded” with only two allowed values: 0 for non-flooded and 1 for flooded areas.
Shahabi et al., 2020 proposed a new flood susceptibility mapping technique utilising ensemble models based on bagging and K-Nearest Neighbour (KNN). The aim was to create maps can be used by a variety of decision-makers and hazard managers to reduce injury and damage to infrastructure from floods using Sentinel-1 radar data and several flood conditioning factors (elevation, slope, curvature, Stream Power Index, Topographic Wetness Index, lithology, rainfall, land use/ land cover, river density and distance to the river). The best performing model was the intelligent hybrid model (Bagging Tree–Cubic KNN), which is a combination of a bagging ensemble technique and the four functions of the KNN classifier. Information Gain Ratio (IGR) was used on the ten flood conditioning factors and showed that, although all factors are significant in the model training, distance to a river stood out as the most important factor, followed by slope gradient and curvature.
Peter et al., 2013 studied flood detection using ML techniques as an alternative to more conventional methods for rapid flood mapping. Although, significant improvements have been made in the near real-time assessments of floods due to increased data acquisition rates, higher sensor resolution, the improvement of change detection algorithms, and the integration of remote sensing systems. However, natural disasters will never be completely predictable. In such situations, rescue teams need to know the current situation in the field and this information is best utilised if the affected area is mapped in real-time. The study concluded that ML assures rapid and accurate mapping. The data used were optical satellite images (SPOT 5), digital terrain models (DTMs), and the river network and the output was a classification model for detecting flooded areas. Normalised difference indices (NDVI, NDBI and NBI) were calculated using the optical image and were inputted as predictors in the classifier algorithms (Naïve Bayes, Bayes Net, J48, Random Tree, and Random Forest). The results proved that the ML algorithms could be used for detecting flooded areas with high accuracy and can only be achieved using both good-quality data and an effective ML algorithm.
Data to train the model is the most common hindrance to using ML algorithms for flood detection. Bonafilia et al., (2020) attempted to tackle this hindrance by providing the Sen1Floods11 dataset. The study aims to assist efforts to operationalise deep learning algorithms for flood mapping on a global scale. Sen1Floods11 is a surface water data set that includes raw Sentinel-1 imagery and classified permanent water and floodwater. This dataset consists of 4,831 512x512 chips covering 120,406 km2 and spans all 14 biomes, 357 ecoregions, and 6 continents of the world across 11 flood events. The dataset was used to train, validate, and test fully convolutional neural networks (FCNNs) to segment permanent and flood water. The Sen1Floods11 dataset consists of four subsets: i) 446 hand labelled chips of surface water from flood events; ii) 814 chips of publicly available permanent water data labels from Landsat (JRC surface water dataset); iii) 4,385 chips of surface water classified from Sentinel-2 images from flood events and iv) 4,385 chips of surface water classified from Sentinel-1 imagery from flood events. This approach was compared to the common remote sensing approach of thresholding radar backscatter to identify surface water. Results show the FCNN model trained on classifications of Sentinel-2 flood events performs best to identify flood and total surface water, while backscatter thresholding yielded the best result to identify permanent water classes only. Thereby suggesting that deep learning models for flood detection using radar data can outperform threshold-based remote sensing techniques and perform better with training labels that include flood water specifically, not just permanent surface water. The source code of the Sen1Floods11 project can be found at: https://github.com/cloudtostreet/Sen1Floods11
3.2.2. Flood Prediction and Modelling
In comparison to traditional statistical models, ML models were used for prediction with greater accuracy. Ortiz-García et al. (2014) described how ML techniques could efficiently model complex hydrological systems such as floods. Many ML algorithms, e.g., artificial neural networks (ANNs), neuro-fuzzy, support vector machine (SVM), and support vector regression (SVR), were reported as effective for both short-term and long-term flood forecast. Besides, it was shown that the performance of ML could be improved through hybridization with other ML methods, soft computing techniques, numerical simulations, and/or physical models. Such applications provided more robust and efficient models that can effectively learn complex flood systems in an adaptive manner (Mosavi et al., 2018).
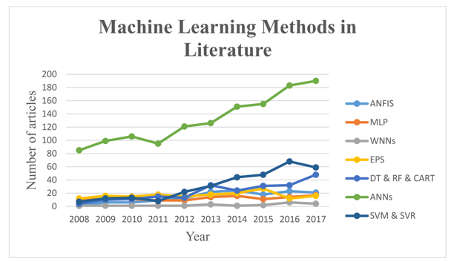
3.3. Common Machine Learning Algorithms
Figure 2 describes the most used ML algorithms found in the literature for flood detection, prediction, and modelling according to Mosavi et al., (2018). A few of the algorithms are described below.
3.3.1. Artificial Neural Networks (ANNs)
ANNs are efficient mathematical modelling systems with efficient parallel processing, enabling them to mimic the biological neural network using inter-connected neuron units. Among all ML methods, ANNs are the most popular learning algorithms, known to be versatile and efficient in modelling complex flood processes with high fault tolerance and accurate approximation. Thus, ANNs are considered as reliable data-driven tools for constructing black-box models of complex and nonlinear relationships of rainfall and flood, as well as river flow and discharge forecasting. ANNs were already successfully used for numerous flood prediction applications, e.g., streamflow forecasting, river flow, rainfall-runoff, precipitation–runoff modelling, water quality, evaporation, river stage prediction, low-flow estimation, flood mapping and susceptibility, and river time series. A major drawback when using ANNs is the need to iterate parameter tuning.
3.3.2. Adaptive Neuro-Fuzzy Inference System (ANFIS)
The fuzzy logic is a qualitative modelling scheme with a soft computing technique using natural language. Fuzzy logic is a simplified mathematical model, which works on incorporating expert knowledge into a fuzzy inference system (FIS). ANFIS further mimics human learning through an approximation function with less complexity, which provides great potential for nonlinear modelling of extreme hydrological events, particularly floods. Due to fast and easy implementation, accurate learning, and strong generalization abilities, ANFIS became very popular in flood modelling.
3.3.3. Decision Tree (DT)
DT is one of the contributors in predictive modelling with a wide application in flood simulation. DT uses a tree of decisions from branches to the target values of leaves. In classification trees (CT), the final variables in a DT contain a discrete set of values where leaves represent class labels and branches represent conjunctions of features labels. When the target variable in a DT has continuous values and an ensemble of trees is involved, it is called a regression tree (RT). Regression and classification trees share some similarities and differences. As DTs are classified as fast algorithms, they became very popular in ensemble forms to model and predict floods. The random forests (RF) method is another popular DT method for flood prediction. RF includes several tree predictors. Each tree creates a set of response predictor values associated with a set of independent values. Furthermore, an ensemble of these trees selects the best choice of classes.
3.3.4. Ensemble Prediction Systems (EPSs)
ML ensembles consist of a finite set of alternative models, which typically allow more flexibility than the alternatives. In recent years, ensemble prediction systems (EPSs) were proposed as efficient prediction systems to provide an ensemble of N forecasts. In EPS, N is the number of independent realizations of a model probability distribution. EPS models generally use multiple ML algorithms to provide higher performance using an automated assessment and weighting system. Such a weighting procedure is carried out to accelerate the performance evaluation process. The advantage of EPS is the timely and automated management and performance evaluation of the ensemble algorithms. Therefore, the performance of EPS, for flood modelling, can be improved. EPSs may use multiple fast-learning or statistical algorithms as classifier ensembles, e.g., ANNs, MLP, DTs, rotation forest (RF) bootstrap, and boosting, allowing higher accuracy and robustness. The subsequent ensemble prediction systems can be used to quantify the probability of floods, based on the prediction rate used in the event. Therefore, the quality of ML ensembles can be calculated based on the verification of probability distribution.
3.3.5. Support Vector Machine (SVM)
SVM is greatly popular in flood modelling; it is a supervised learning machine which works based on statistical learning theory and the structural risk minimization rule. The training algorithm of SVM builds models that assign new non-probabilistic binary linear classifiers, which minimize the empirical classification error and maximize the geometric margin via inverse problem-solving. SVM is used to predict a quantity forward in time based on training from past data. SVMs are today known as robust and efficient ML algorithms for flood prediction. SVM and SVR emerged as alternative ML methods to ANNs, with high popularity among hydrologists for flood prediction. Thus, they are applied in numerous flood prediction cases with promising results, excellent generalization ability, and better performance, compared to ANNs, e.g., extreme rainfall, precipitation, rainfall-runoff, reservoir inflow, streamflow, flood quantiles, flood time series, and soil moisture.
4. Advantages
ML models have been increasingly used to predict, map and monitor flood events providing better performance and cost-effective solutions. Advancement of flood prediction models is essential for risk reduction, policy suggestion, minimization of the loss of human life, rapid flood mapping, and reduction of property damage associated with floods. Flood prediction using machine-learning algorithms is effective due to its ability to utilize data from various sources and classify and regress it into flood and non-flood classes.
The drawbacks of the physically based and statistical models mentioned above encourage the usage of advanced data-driven models, e.g., ML. Data-driven methods of prediction assimilate the measured climate indices and hydro-meteorological parameters to provide better insight. Many ML algorithms, e.g., artificial neural networks (ANNs), neuro-fuzzy, support vector machines (SVM), and support vector regression (SVR), have been reported as effective for both short-term and long-term flood forecasts (Mosavi et al., 2018).
A further reason for the popularity of ML models is that they can numerically formulate the flood nonlinearity, solely based on historical data without requiring knowledge about the underlying physical processes. Data-driven prediction models using ML are promising tools as they are quicker to develop with minimal inputs.
In flood-forecasting, traditional methods of predicting hazard variables can involve a chain of hydrologic and hydraulic models that describe the physical processes. Although such models provide system understanding, they often have high computational and data requirements. Therefore, the use of process models may not always be feasible or necessary in the preparation stage of a disaster. ML methods have the potential to improve accuracy as well as reduce calculating time and model development cost. At that moment, accurate and timely outputs become more important than system understanding, and the use of ‘black-box’ ML models is becoming more widespread (Wagenaar et al., 2020).
5. Limitations
Despite ML algorithms numerous advantages, they have important characteristics that are often limitations.
The first is that they are as good as their training, whereby the system learns the target task based on past data. If the data is scarce or does not cover varieties of the task, their learning falls short, and hence, they cannot perform well when they are put into work. Therefore, using a robust training dataset is essential.
Second, the capability of each ML algorithm, which may vary across different types of tasks. This can also be called a “generalization problem”, which indicates how well the trained system can predict cases it was not trained for, i.e., whether it can predict beyond the range of the training dataset. For example, some algorithms may perform well for short-term predictions, but not for long-term predictions. These characteristics of the algorithms need to be clarified concerning the type and amount of available training data, and the type of prediction task.
The task of choosing the best-performing ML algorithm can be difficult due to data complexity and commonly requires a trial-and-error approach of the tuning parameters.
The accuracy of the ML algorithm used is very much dependent on the tuning parameters and the best tuning parameters values are not static for every dataset.
6. References
Bonafilia, D., Tellman, B., Anderson, T., & Issenberg, E. (2020). Sen1Floods11: A georeferenced dataset to train and test deep learning flood algorithms for sentinel-1. IEEE Computer Society Conference on Computer Vision and Pattern Recognition Workshops, 2020-June, 835–845. https://doi.org/10.1109/CVPRW50498.2020.00113
Casella, G., Fienberg, S., & Olkin, I. (2006). An Introduction to Statistical Learning. In Design (Vol. 102). https://doi.org/10.1016/j.peva.2007.06.006
Huang, C., Chen, Y., Zhang, S., & Wu, J. (2018). Detecting, Extracting, and Monitoring Surface Water From Space Using Optical Sensors: A Review. Reviews of Geophysics, 56(2), 333–360. https://doi.org/10.1029/2018RG000598
IPCC. (2012). Managing the Risks of Extreme Events and Disasters to Advance Climate Change Adaptation. In Special Report of the Intergovernmental Panel on Climate Change (Vol. 9781107025). https://doi.org/10.1017/CBO9781139177245.009
Lamovec, P., Veljanovski, T., Mikoš, M., & Oštir, K. (2013). Detecting flooded areas with machine learning techniques: case study of the Selška Sora river flash flood in September 2007. Journal of Applied Remote Sensing, 7(1), 073564. https://doi.org/10.1117/1.jrs.7.073564
Lee, S., Hahn, C., Rhee, M., Oh, J. E., Song, J., Chen, Y., Lu, G., Perdana, & Fallis, A. . (2012). E-Agriculture in Action: Big Data for Agriculture. In Journal of Chemical Information and Modeling (Vol. 53, Issue 9). http://dx.doi.org/10.1016/j.tws.2012.02.007
Liu, Q., & Wu, Y. (2012). Supervised Learning. Encyclopedia of the Sciences of Learning, January 2012. https://doi.org/10.1007/978-1-4419-1428-6
Mosavi, A., Ozturk, P., & Chau, K. W. (2018). Flood prediction using machine learning models: Literature review. Water (Switzerland), 10(11). https://doi.org/10.3390/w10111536
Peter, L., Matjaž, M., & Krištof, O. (2013). Detection of Flooded Areas using Machine Learning Techniques : Case Study of the Ljubljana Moor Floods in 2010. June 2014.
Rubinato, M., Nichols, A., Peng, Y., Zhang, J. min, Lashford, C., Cai, Y. peng, Lin, P. zhi, & Tait, S. (2019). Urban and river flooding: Comparison of flood risk management approaches in the UK and China and an assessment of future knowledge needs. Water Science and Engineering, 12(4), 274–283. https://doi.org/10.1016/j.wse.2019.12.004
Seo, Y., & Kim, S. (2016). River Stage Forecasting Using Wavelet Packet Decomposition and Data-driven Models. Procedia Engineering, 154, 1225–1230. https://doi.org/10.1016/j.proeng.2016.07.439
Shahabi, H., Shirzadi, A., Ghaderi, K., Omidvar, E., Al-Ansari, N., Clague, J. J., Geertsema, M., Khosravi, K., Amini, A., Bahrami, S., Rahmati, O., Habibi, K., Mohammadi, A., Nguyen, H., Melesse, A. M., Ahmad, B. Bin, & Ahmad, A. (2020). Flood detection and susceptibility mapping using Sentinel-1 remote sensing data and a machine learning approach: Hybrid intelligence of bagging ensemble based on K-Nearest Neighbor classifier. Remote Sensing, 12(2). https://doi.org/10.3390/rs12020266
Veljanovski, T., Lamovec, P., Pehani, P., & Oštir, K. (2011). Comparison of three techniques for detection of flooded areas on ENVISAT and RADARSAT-2 satellite images. Gi4DM 2011 - GeoInformation for Disaster Management.
Wagenaar, D., Curran, A., Balbi, M., Bhardwaj, A., Soden, R., Hartato, E., Mestav Sarica, G., Ruangpan, L., Molinario, G., & Lallemant, D. (2020). Invited perspectives: How machine learning will change flood risk and impact assessment. Natural Hazards and Earth System Sciences, 20(4), 1149–1161. https://doi.org/10.5194/nhess-20-1149-2020
Zehra, N. (2020). Prediction Analysis of Floods Using Machine Learning Algorithms ( NARX & SVM ). International Journal of Sciences: Basic and Applied Research (IJSBAR), 4531, 24–34.