
Overview of the Disaster and Objectives
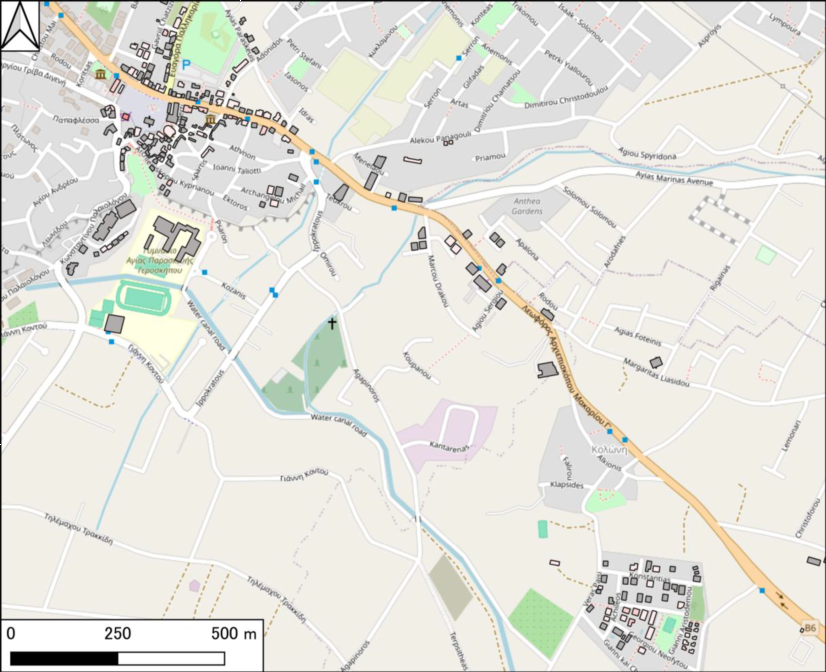
A magnitude 5.2 earthquake struck the southwestern region of Cyprus near the city of Paphos on 12 November 2025. According to Earthquakelist.org, the event occurred at a shallow depth of approximately 10 km with an epicenter located about 5 km east of Paphos (34.78°N, 32.48°E). Shaking was widely felt across Cyprus and reported from 47 locations in five countries. Despite the shallow focus and strong perceptibility, no major structural damage or casualties were reported by local authorities. Several public buildings in the Paphos area were temporarily evacuated as a precautionary measure.
Source: https://earthquakelist.org/news/2025/11/12/m5-2-earthquake-cyprus-1209930/
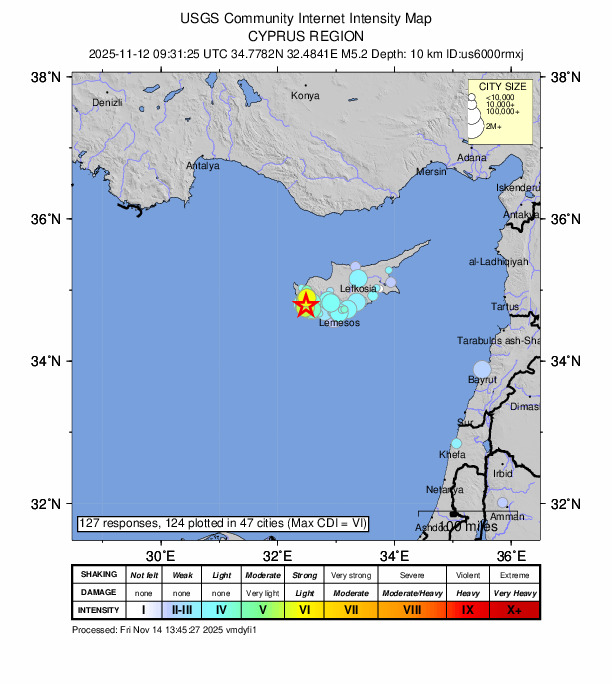
Source: https://earthquake.usgs.gov/earthquakes/eventpage/us6000rmxj/executive
Satellite Data and Analytical Method
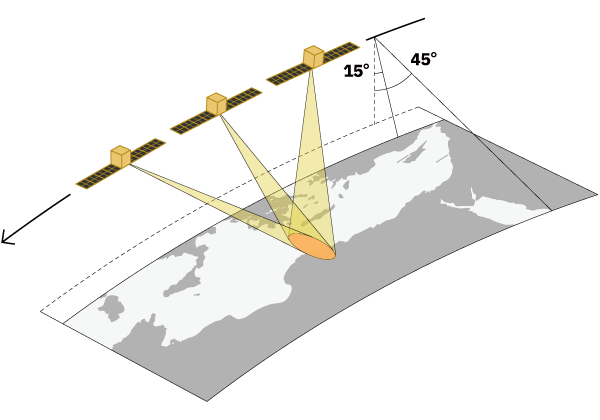
To support the damage assessment, a high-resolution SAR data product was made available from the StriX-4 satellite as the post-disaster imagery. The post-event imagery was acquired on 17 November 2025 at 04:58 JST using the Staring Spotlight-4 mode (0.46 × 0.25 m), with an off-nadir angle of 41.3°, descending and right-looking. The observation footprint covers the Paphos metropolitan area and its surroundings.
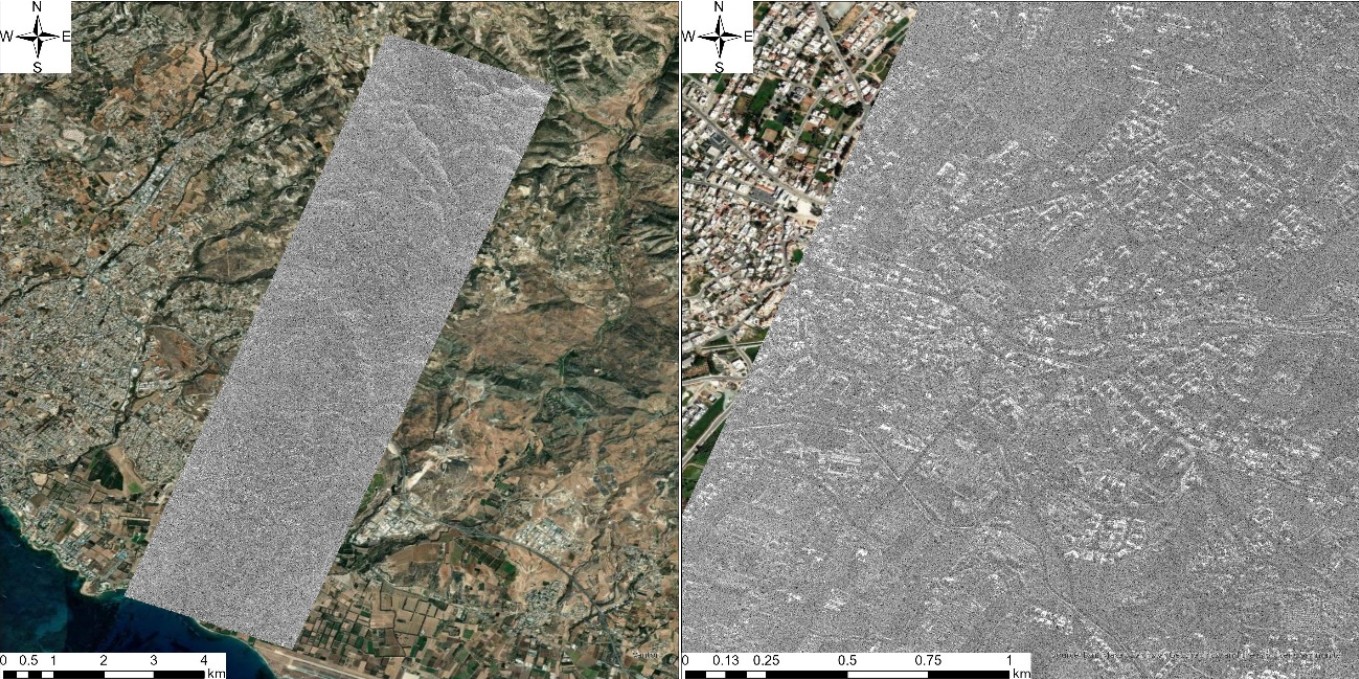
Source: https://synspective.com/press-release/2024/staringspotlight_25cm/
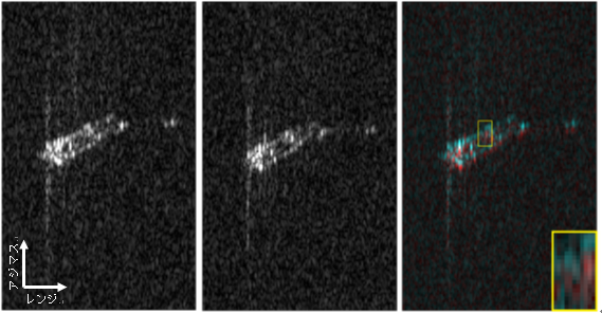
The data product included sub-aperture information, enabling the application of the Colorized Subaperture Image (CSI) analysis, a technique derived from sub-aperture SAR processing. In synthetic aperture radar imaging, the radar antenna’s movement produces a long azimuth aperture that is typically combined into a single coherent image. Sub-aperture analysis divides this aperture into several shorter segments, each representing slightly different look angles or radiation geometries during the data acquisition. Because objects on the ground reflect microwaves differently depending on subtle changes in angle, each sub-aperture encapsulates unique scattering characteristics of the same target.
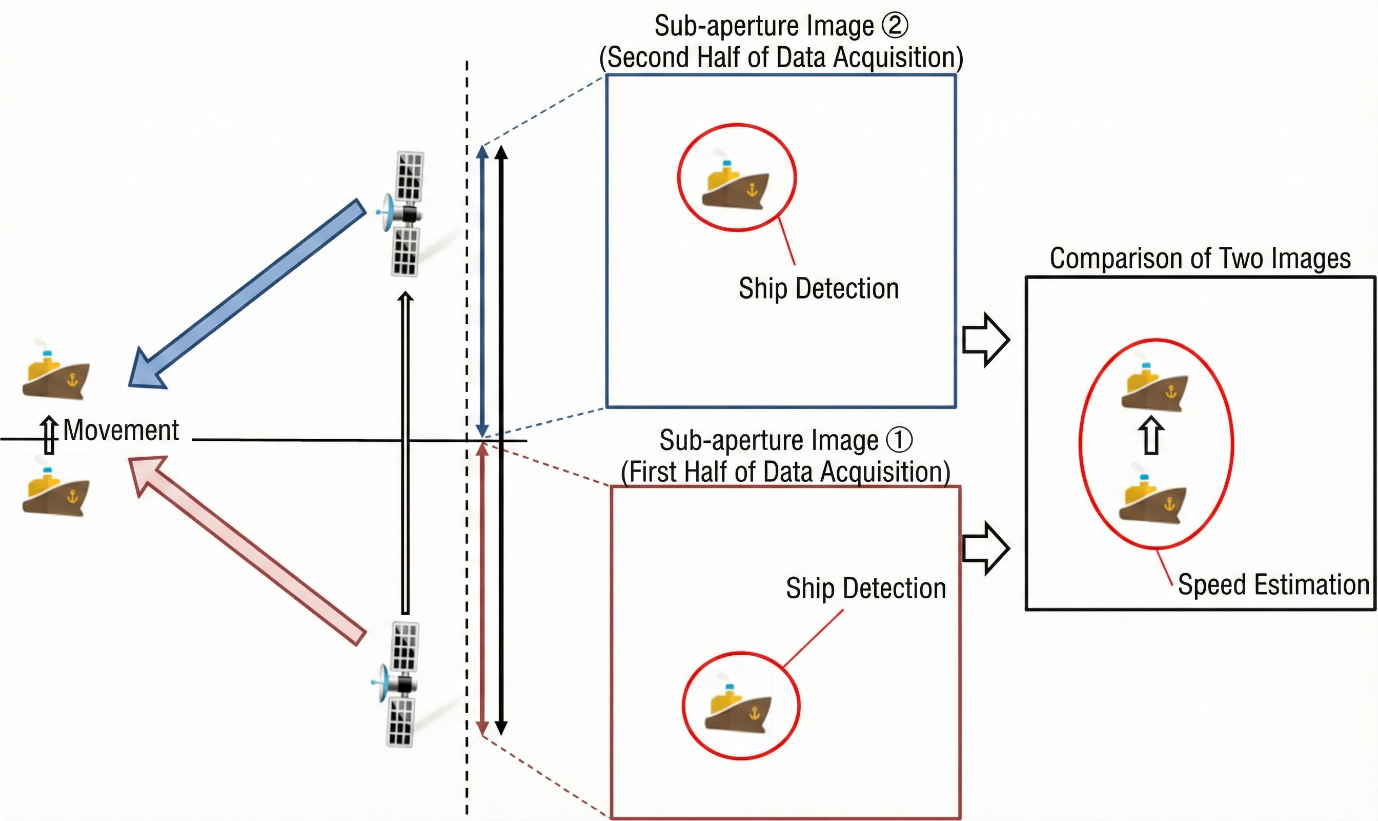
CSI analysis recombines these sub-aperture images into a color composite by assigning different sub-apertures to separate color channels (e.g., red, green, blue). Structural changes such as collapse or the presence of debris often produce angle-independent high backscatter, which appears as bright or white regions in the composite image. Intact buildings, by contrast, tend to maintain more uniform scattering patterns across sub-apertures and therefore appear darker or more homogeneous.
This method allows the identification of buildings with potential structural damage even when only post-event imagery is available. Since no pre-event StriX imagery was included in the provided dataset, CSI offered a rapid, single-date method for detecting anomalous scattering signatures consistent with damage. The analysis made use of OpenStreetMap (OSM) building footprints to define candidate structures, although many buildings visible in the SAR imagery were not present in OSM and therefore could not be systematically evaluated.
Example of how buildings appear in CSI analysis is that when a building has completely collapsed and debris has accumulated, the backscatter remains strong even as the illumination angle changes, causing the entire building area to appear bright (white) in the CSI image. In contrast, buildings without collapse tend to appear dark within their footprint, although some small bright areas may still be present.
Results
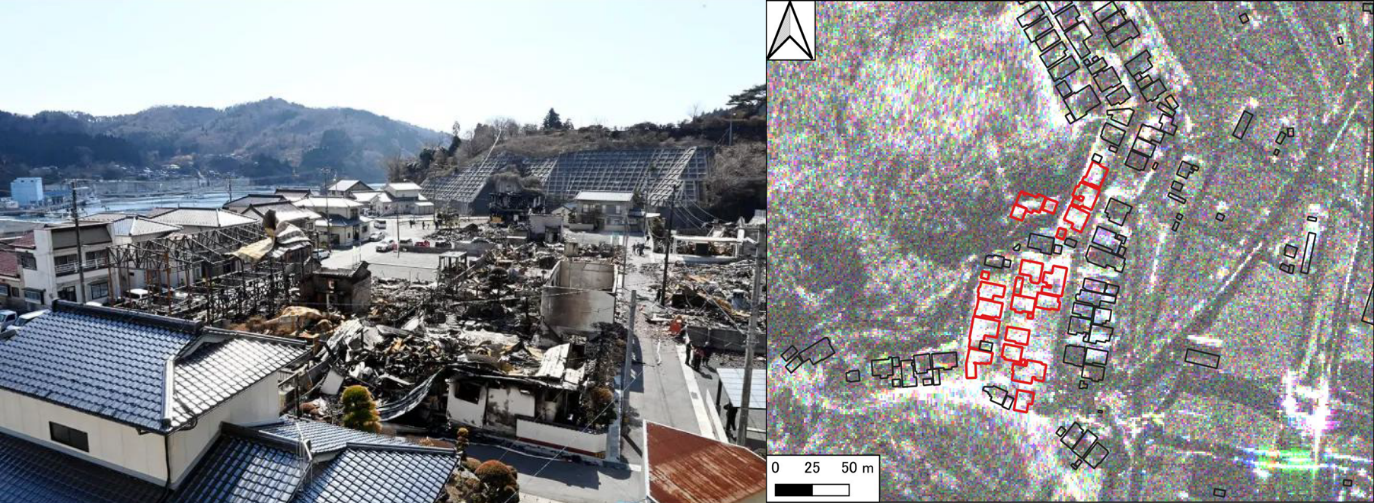
The CSI-based assessment revealed that only a small number of buildings within the OSM dataset were classified as having high potential damage. These results aligned with ground reports indicating that the earthquake did not cause widespread structural collapse via website exploration. Buildings flagged as having higher damage potential appeared as bright features in the CSI composite, while the majority of structures showed signatures consistent with undamaged conditions.
Given the limitations associated with incomplete building footprints, the analysis does not exclude the possibility of undetected minor or moderate damage. Nevertheless, the results provided a rapid, objective indication that large-scale destruction was unlikely.
Technical Notes
The StriX constellation offers high-resolution SAR imagery with revisit capabilities suitable for disaster response. The CSI technique enables rapid extraction of potential damage indicators from single-date imagery by exploiting differences in backscatter across sub-apertures. This approach minimizes the need for pre-event imagery and supports timely assessment when field access is limited.
Current limitations include:
- Incomplete OSM building footprints in the affected region, reducing the number of structures available for analysis;
- Higher detection reliability for complete structural collapse than for partial or moderate damage;
- Sensitivity to acquisition geometry (azimuth and range direction) and potential polarization dependencies, which may influence backscatter interpretation.
Despite these limitations, the CSI-based assessment significantly contributed to confirming that no large-scale structural damage occurred.
Acknowledgments
UN-SPIDER expresses its appreciation for the availability of the StriX-4 data product and accompanying sub-aperture information, which enabled the rapid application of CSI analysis for this event. This cooperation highlights the importance of timely access to Earth observation data for enhancing disaster response and supporting evidence-based decision-making.