Nataliia Kussul, Andrii Shelestov, Sergii Skakun
Space Research Institute NASU-NSAU, Ukraine
Introduction
Presently, global climate change on the Earth made a rational land use, environmental monitoring, prediction of natural and technological disasters tasks of great importance. The basis of the solution for these crucial problems lies in the integrated use of data of different nature: modeling data, in-situ measurements and observations, and indirect observations such as airborne and space borne remote sensing data [1].
In particular, models can be used to fill in the gaps in data by extrapolating and estimating necessary parameters to the site of interest and to better understand and predict different processes occurring in the atmosphere, land, ocean and sea, etc; they can also help to interpret measurements and to design new observing systems. In-situ measurements are often used for assimilation into models, calibration and validation of both modeling and remote sensing data. Satellite observations have an advantage of acquiring data for large and hard-to-reach areas, as well as providing continuous and human-independent measurements. Many important applications such as monitoring and predictions of natural disasters, environmental monitoring, etc. heavily rely on the use of Earth Observation (EO) data from space. For example, satellite-derived flood extent is very important for calibration and validation of hydraulic models to reconstruct what happened during the flood and determine what caused the water to go where it did [2]. Information on flood extent provided in the near real-time (NRT) can also be used for damage assessment and risk management, and can also benefit rescuers during flooding. Both space-borne microwave and optical data can provide means to detect drought conditions, estimate drought extent and assess the damage caused by the drought events [3, 4]. To assess vegetation health/stress, which is extremely important for agriculture applications, optical remote sensing data can be used to derive biophysical and biochemical variables such as pigment concentration, leaf structure, water content at leaf level and leaf area index (LAI), fraction of photosynthetically active radiation absorbed by vegetation (FPAR) at canopy level etc. [5].
The EO domain is characterized by the large volumes of data that should be processed, catalogued, and archived [6, 7, 8]. The processing of satellite data is carried out not by a single application with a monolithic code, but by distributed applications. This process can be viewed as a complex workflow [9] that is composed of many tasks: geometric and radiometric calibration, filtering, reprojection, composites construction, classification, products development, post-processing, visualization, etc. For example, calibration and mosaic composition of 80 images generated by the ASAR instrument onboard the Envisat satellite takes three days on ten workstations of an Earth Science GRID on Demand that is being developed at ESA and ESRIN [6]. Dealing with EO data, we have to also consider the security issues regarding satellite data policy, the need for processing in NRT for fast response within international programs and initiatives, in particular the International Charter "Space and Major Disasters".
It should be also noted that the same EO data sets and derived products can be used for a number of applications. For example, information on land use/change, soil properties, meteorological conditions etc. is both important for floods- and droughts-related applications as well as for vegetation state assessment. That is, once we develop interfaces to discover and access the required data and products, they can be used in a uniform way for different purposes and applications. This represents one of the important tasks that are being solved within the development of the Global Earth Observation System of Systems [1] and the European initiative Global Monitoring for Environment and Security [10]. Services and models that are common for different EO applications (e.g. flood monitoring and crop yield prediction) are shown in Figure 1.
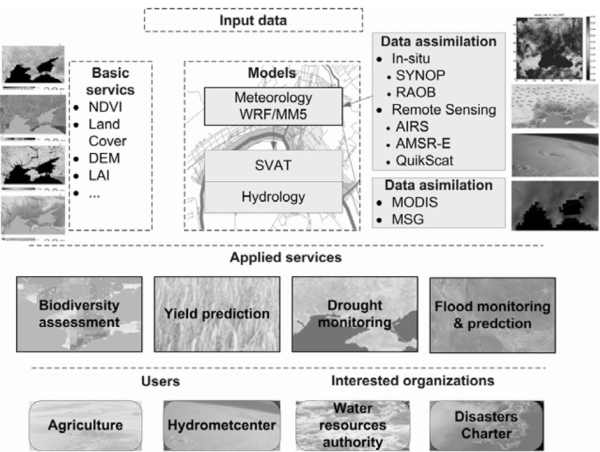
Figure 1. Common services and models for a variety of applications
A considerable need therefore exists for an appropriate geospatial infrastructure that will enable the integrated and operational use of multi-source data for different applications domains. In this paper, we focus on the description of service-oriented infrastructure that is being developed in the Space Research Institute NASU-NSAU (SRI NASU-NSAU). We will describe several real-world applications that are addressed using the infrastructure, namely flood- and fire monitoring. The geospatial services developed within the infrastructure are delivered to end-users through the UN-SPIDER Regional Support Office in Ukraine that was established in February 2010.
Service-oriented infrastructure for satellite data processing
One of the most important problems associated with satellite data processing for disaster management is the timely delivery of information to end-users. To enable such capabilities, an appropriate infrastructure is required to allow for rapid and efficient access to, processing and delivery of geospatial information that is further used for damage assessment and risk management. In this section, we will describe the overall architecture of such a system and show how it is being used for automated acquisition, processing and visualization of satellite Synthetic-Aperture Radar (SAR) and optical data for rapid flood mapping and fire monitoring. The developed services are used within the UN-SPIDER Regional Support Office in Ukraine, that was established in February of 2010.
Overall Architecture
Within a system we developed a set of services (Fig. 2). We followed an approach that is used in the Earth System Grid [11]. The four major components of the system are as follows:
- Client applications. Web portal is a main entry point, and provides interfaces to communicate with system services.
- High-level services. This level includes a security subsystem, catalogue services, metadata services (description and access), automatic workflow generation services, and data aggregation, sub-setting & visualization services. All these services are connected to Grid services at the lower level.
- Grid services. These services provide access to the shared resources of the Grid system, access to credentials, file transfer, job submission and management.
- Database and application services. This level provides physical data and computational resources of the system.
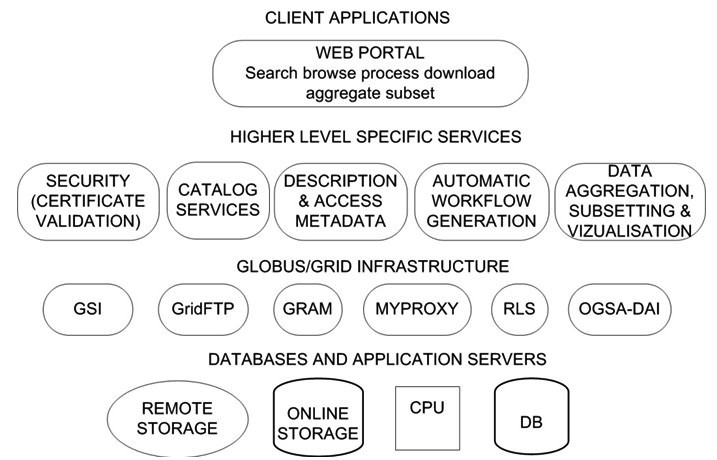
Figure 2. System architecture
Workflow of flood extent extraction from satellite (SAR) imagery
Within the infrastructure we developed an automated workflow of satellite SAR data acquisition, processing and visualization, and corresponding geospatial services for flood mapping from SAR imagery. The data are automatically downloaded from ESA rolling archives where satellite images are available within 2-4 hours after their acquisition. We implemented both programming and graphical interfaces to enable search, discovery and acquisition of data (Fig. 3). Through the portal the user can select a geographical region of interest and a time range, and find the data that matches the search request. After the user selects a file to be processed, it is transferred to the resources of the Grid system at the Space Research Institute NASU-NSAU. Following that, a workflow is automatically generated and executed on the resources of the Grid infrastructure.
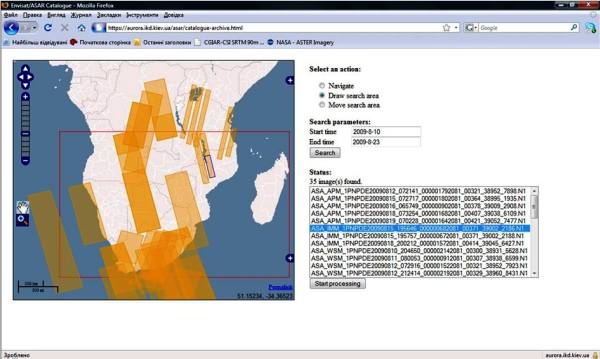
Figure 3. Portal for flood mapping from satellite SAR data
We developed a neural network approach to SAR image segmentation and classification [8]. The workflow of data processing is as follows (Fig. 4):
- Data calibration. Transformation of pixel values (in digital numbers) to backscatter coefficient (in dB).
- Orthorectification and geocoding. This step is intended to remove geometrical and radiometric errors associated with SAR imaging technology, and apply corrections to provide precise georeferencing of the data.
- Image processing. Segmentation and classification of the image using neural network.
- Topographic effects removal. Using a digital elevation model (DEM), such effects as shadows are removed from the image. The output of this step is a binary image classified into two classes: “Water” and “No water”.
- Transformation to geographic projection. The image is transformed to a projection for further visualisation via Internet using OGC-compliant standards (KML or WMS) or desktop Geographic Information Systems (GIS) using shape file.
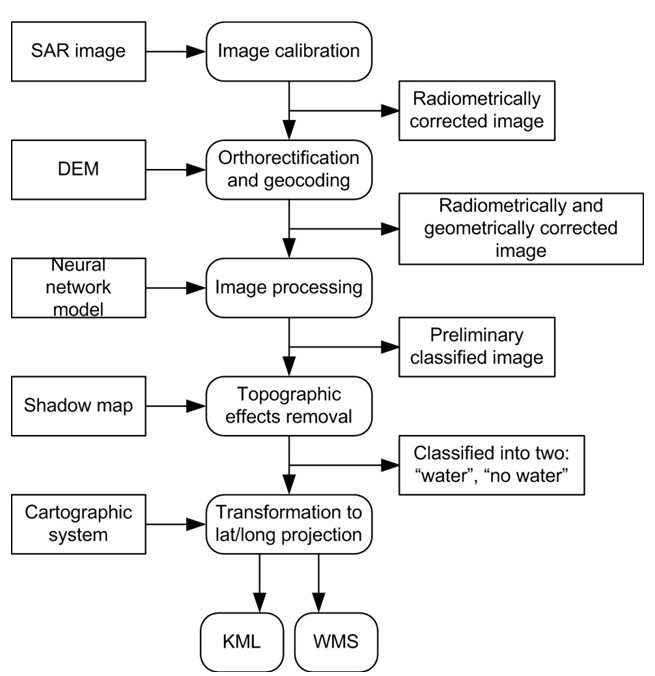
Figure 4. Workflow of flood extent extraction from SAR satellite imagery
After processing the user request from the portal, such a workflow is automatically generated and is executed on the resources of the Grid system. Through the portal the user can monitor the status of each step of the workflow. After the workflow is completed, a flood map is delivered to the user via OGC-compliant standards.
Application services
Flood monitoring
The above-described infrastructure is used within the Ukrainian UN-SPIDER RSO to produce flood maps all over the World. For this purpose, we use both optical and SAR satellite data, in particular Envisat/ASAR, Radarsat-1/2, EO-1 and Landsat-5.
Flood Monitoring in Ukraine 2010
The severe 2010 winter in Ukraine that was characterized by large amounts of snow and ice on rivers posed a high threat of floods during the melting period. A lot of efforts have been made by the Ukrainian Government to prevent and reduce consequences of potential disasters. The UN-SPIDER Regional Support Office (RSO) in Ukraine that was established at the Space Research Institute (SRI) NASU-NSAU in the beginning of 2010 played an active role in these efforts.
In order to provide flood risk assessment both synthetic-aperture radar (SAR) and optical satellite imagery were used. In particular, we acquired more than 30 Envisat/ASAR scenes during the 2010 winter-spring period, and more than 50 archived scenes during autumn 2009 to monitor the snow cover. Using the Sensor Web system we acquired 3 scenes from NASA’s EO-1/ALI instrument. Timeline of delivery of satellite images and products in case of a disaster in this particular case Ishould be emphasized (Fig. 5). For example, for the EO-1 April image we received a notification on EO-1 tasking for the target area on Monday Apr 12, 2010 @10:33 PM local time. The image was taken on Tuesday Apr 13, 2010 @11:33 AM and was made available on ftp the same day @04:30 PM. A pan-sharpened image was available as KML on the web Tue Apr 13, 2010 @11:30 PM after only 12 hrs from time the image was taken. Figure 6 shows changes in snow cover and ice formation on the Dnieper River near the Kyiv city area.

Figure 5. Timeline of EO-1 / Advanced Land Imaging for the 13 April image
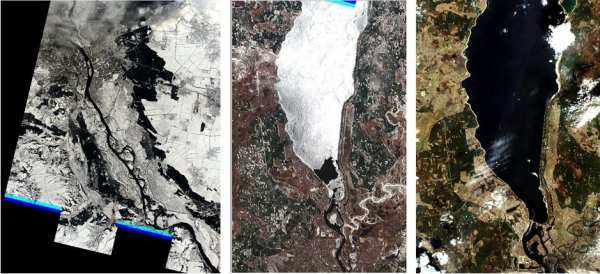
Figure 6. EO-1 images of Kyiv area for 10 March (left), 23 March (middle) and 13 April, 2010 (right). Left image shows strong presence of snow cover in early March. From the image taken on 23 March it can be seen that snow has already melted while there is still an ice cover on the river (on top). This ice posed a high threat to the houses and constructions along the river. Right image shows no snow or ice on the land and the river. Data courtesy of the NASA Earth Observing One (EO-1) Mission operated by the NASA Goddard Space Flight Center.
The produced geospatial products were delivered to the Ukrainian Ministry of Emergency Situations, the Council of National Security and Defense, and the Ukrainian Hydrometeorological Center. Information on river extent that was derived from EO-1 images was also used to calibrate and validate hydrological models to produce various scenarios of water extent for flood risk assessment.
Flood Monitoring in Namibia 2010
The UN-SPIDER RSO in Ukraine is also actively involved in the Namibia SensorWeb Pilot Project – a joint effort of UNOOSA/UN-SPIDER, NASA, NOAA, DLR and SRI NASU-NSAU. SRI’s main role lies in rapid flood mapping from SAR satellite imagery. More than 20 scenes from the Envisat/ASAR instrument have already been acquired for Namibia during 2010, and corresponding flood maps were produced. Figure 7 shows an example of one of these products. This information along with information and products provided by the project partners will be used for the integrated analysis of floods in Namibia.
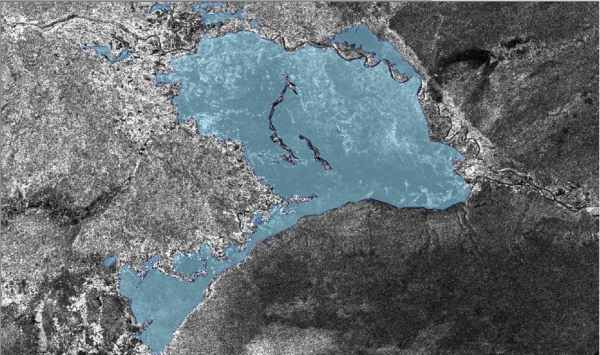
Figure 7. Flood extent shown in light-blue derived from Envisat/ASAR Wide Swath Mode imagery on 30 May, 2010. Image covers Caprivi region of Namibia. (Image copyright ESA 2010)
Integration of ground and satellite data to validate flood products
In order to provide validation of flood mapping products, ground data were collected during a U.N. Technical Advisory visit in Namibia (25-27 January 2010). These data were collected with a camera and GPS. Corresponding satellite imagery was acquired to support the field campaign (Fig. 8), in particular:
- Envisat/ASAR, 30 January 2010,
- Landsat-5/TM, 26 January 2010.
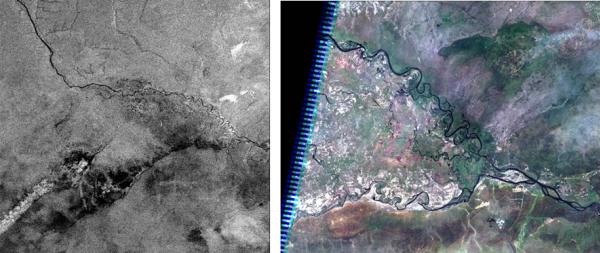
Figure 8. Envisat/ASAR acquired on 30 January 2010 (left) and Landsat-5/TM acquired on 26 January 2010 (right) covering Caprivi region of Namibia
The satellite images and photos that were geo-tagged were integrated in the Google Earth application.
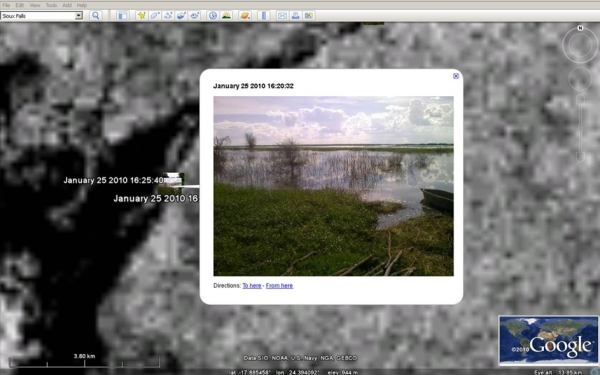
Figure 9. Integration of Envisat/ASAR imagery and ground photos with Google Earth. Note that open flat water appears black (with low backscatter coefficient) on radar imagery while water with vegetation appears bright.
Fire monitoring
The 2010 summer in Ukraine was characterized by extremely high temperatures that posed a high risk of fires. In particular, the temperature exceeded +35-39ºC in Eastern regions of Ukraine, and +40-42ºC in Southern regions. According to the Ministry of Emergency Situations of Ukraine approximately 3000 fires were detected from 5 to 20 August (that constitutes approx. 200 fires per day), 2200 of them were forest fires with an area of 6500 ha being affected. In order to enable monitoring and detection of fires the following satellite data sets were used:
- EO-1/ALI, acquired on 14.08.2010 08:15 UTC
- Landat-5 TM, acquired on 02.08.2010 08:15 UTC
- Fire services provided by Center for Satellite Based Crisis Information (ZKI) of DLR
Figures 10 and 11 show fire detection products from Landsat-5 TM imagery and MODIS, respectively.
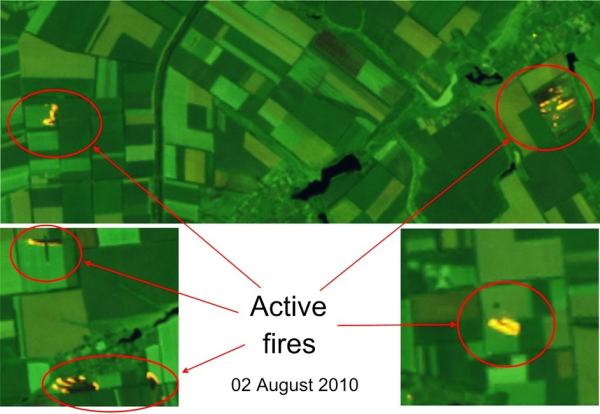
Figure 10. Active fires detected by Landsat-5/TM
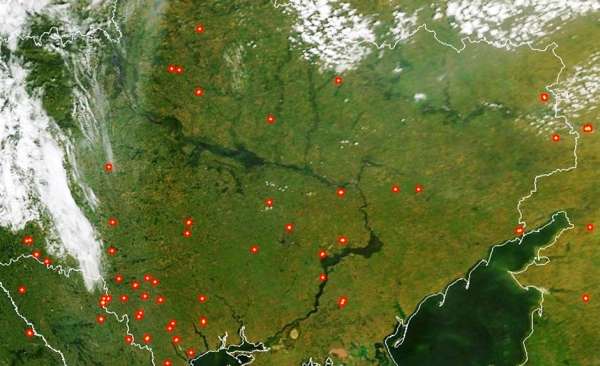
Figure 11. Hotspots detected by MODIS
Conclusions
In this paper we describe service-oriented infrastructure for disaster management based on satellite data. The infrastructure exploits a number of generic services to enable access to, processing and delivery of geospatial information. In particular, within the system we developed an automated workflow of satellite SAR data acquisition, processing and visualization, and corresponding geospatial services for flood mapping from SAR imagery. This allows us to produce flood maps within 24 hours after data acquisition. Using ground data that were collected during a U.N. Technical Advisory Mission in Namibia we provided validation of flood maps generated from SAR imagery. While the open water can be detected easily from SAR imagery, detection of water with strong vegetation cover represents an issue. Another application that is covered in the paper is fire monitoring. The use of satellite data with different spatial resolutions and coverage allowed us to provide both national and regional detection of fires.
References
- The Global Earth Observation System of Systems (GEOSS) http://www.earthobservations.org.
- M.S. Horritt, A methodology for the validation of uncertain flood inundation models. J. of Hydrology, 326, 153-165 (2006).
- F. Kogan, R. Stark, A. Gitelson, E. Adar, L. Jargalsaikhan, C. Dugrajav, and S. Tsooj, Derivation of Pasture Biomass in Mongolia from AVHRR-based Vegetation Health Indices. Int. J. Remote Sens, 25(14), 2889-2896 (2004).
- W. Wagner, C. Pathe, D. Sabel, A Bartsch., C. Kuenzer and K. Scipal, Experimental 1 km soil moisture products from ENVISAT ASAR for Southern Africa, ENVISAT and ERS Symposium, Montreux, Switzerland, 23-27.04.2007.
- S. Liang, Quantitative Remote Sensing of Land Surfaces, Wiley, Inc., 534 p (2004).
- L. Fusco, R. Cossu and C. Retscher Open Grid Services for Envisat and Earth Observation Applications. In: Plaza AJ, Chang C-I (ed) High performance computing in remote sensing, 1st edn. Taylor & Francis Group, New York, 237-280 (2007).
- A. Shelestov, N. Kussul and S. Skakun Grid Technologies in Monitoring Systems Based on Satellite Data. J. of Automation and Inf. Sci., 38(3), 69-80 (2006).
- N. Kussul, A. Shelestov andS. Skakun, Grid System for Flood Extent Extraction from Satellite Images. Earth Science Informatics, 1(3-4), 105-117 (2008).
- Project: Dissemination and Exploitation of Grids in Earth Science, https://www.eu-degree.eu.
- The European Earth Observation Programme (GMES). http://www.gmes.info.
- D.N. Williams et al, Data management and analysis for the Earth System Grid. J. Phys.: Conf. Ser. 125 012072. (2008) doi: 10.1088/1742-6596/125/1/012072
