• English
  • Español
  • Français

United
Nations


Office for Outer Space Affairs
UN-SPIDER Knowledge Portal

  • Accueil
  • À propos
    • Qu'est-ce que l'ONU-SPIDER?
    • À propos d’UNOOSA
    • Publications
    • Offres d'emploi
    • Rencontrez l'équipe
    • Contact
  • Applications spatiales
    • Technologie satellitaire
    • Mécanismes d’urgence
    • Recovery Mechanisms
    • Réseau international d'alerte aux astéroïdes
    • Space Mission Planning Advisory Group
    • Initiative internationale sur la météorologie spatiale
    • Les technologies spatiales à l'ONU
    • Comptes-rendus d'utilisateurs
  • Liens & ressources
    • Application de données du mois
      • Disaster Recovery
    • Sources de données
    • SIG et logiciels de télédétection
    • Online Learning Resources
    • Institutions
  • Risques & catastrophes
    • Prévention des risques de catastrophe
    • Systèmes d'alerte précoce
    • Gestion des catastrophes et des interventions d'urgence
    • Aléas naturels
    • Cadre d'action de Sendai
    • L'ONU et la prévention des risques de catastrophe
    • L'ONU et les alertes précoces
    • L'ONU et la gestion des catastrophes
  • Appui technique
    • Missions Conseil
    • Appui d’urgence
    • Appui à distance
    • Pratiques recommandées
    • Activités de formation
    • Utilisations pratiques
  • Réseaux
    • Bureaux régionaux d’appui
    • GP-STAR
    • MHEWS
    • IWG-SEM
  • Projets
    • SPEAR
    • SEWS-D
    • EvIDENz
    • Flood GUIDE
  • Actualités
    • Actualités
    • Événements
    • Événements passés

Breadcrumb

  • Home
  • New Interactive Online Map Shows Forest Loss And Gain From 2000-2012
  • New interactive online map shows forest loss and gain from 2000-2012

New interactive online map shows forest loss and gain from 2000-2012

First map of forest change that is globally consistent and locally relevantResearchers expect to use the map to assess the effectiveness of forest management programmes and to monitor the impacts of deforestation

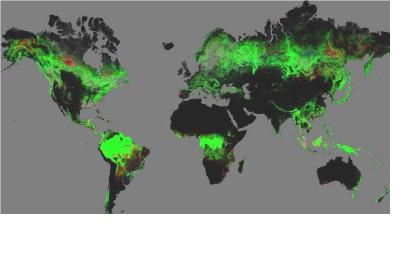
A new high-resolution global map has been created as an interactive online tool that shows forest loss and gain from 2000 to 2012. "This is the first map of forest change that is globally consistent and locally relevant," said Prof Matthew Hansen of the University of Maryland, who led the project team which developed the map with the additional help of Google Earth.

Based on 650,000 satellite images by Landsat 7, the map shows a number of key findings on forest change during 2000-2012 like an increasing in tropical forest loss by about 2,100 sq km per year. The map is publicly available and zooms in to a remarkably high level of local detail - a resolution of 30m. Green areas of the map represent forested areas; red suffered forest loss; blue showed forest gain; pink experienced both loss and gain.

Researchers expect to use the map to assess the effectiveness of forest management programmes and to monitor the impacts of deforestation - including biodiversity threats, carbon storage and climate change. "This new monitoring approach can for the first time provide - on a global scale - transparent accountability for monitoring progress toward achieving real declines in deforestation," said Daniel Zarin, of the Climate and Land Use Alliance.
BBC
Mon, 18 Nov 2013 - 14:05

Footer menu

  • Contact
  • Terms of Use

User account menu

  • Log in