• English
  • Español
  • Français

United
Nations


Office for Outer Space Affairs
UN-SPIDER Knowledge Portal

  • Accueil
  • À propos
    • Qu'est-ce que l'ONU-SPIDER?
    • À propos d’UNOOSA
    • Publications
    • Offres d'emploi
    • Rencontrez l'équipe
    • Contact
  • Applications spatiales
    • Technologie satellitaire
    • Mécanismes d’urgence
    • Recovery Mechanisms
    • Réseau international d'alerte aux astéroïdes
    • Space Mission Planning Advisory Group
    • Initiative internationale sur la météorologie spatiale
    • Les technologies spatiales à l'ONU
    • Comptes-rendus d'utilisateurs
  • Liens & ressources
    • Application de données du mois
      • Disaster Recovery
    • Sources de données
    • SIG et logiciels de télédétection
    • Online Learning Resources
    • Institutions
  • Risques & catastrophes
    • Prévention des risques de catastrophe
    • Systèmes d'alerte précoce
    • Gestion des catastrophes et des interventions d'urgence
    • Aléas naturels
    • Cadre d'action de Sendai
    • L'ONU et la prévention des risques de catastrophe
    • L'ONU et les alertes précoces
    • L'ONU et la gestion des catastrophes
  • Appui technique
    • Missions Conseil
    • Appui d’urgence
    • Appui à distance
    • Pratiques recommandées
    • Activités de formation
    • Utilisations pratiques
  • Réseaux
    • Bureaux régionaux d’appui
    • GP-STAR
    • MHEWS
    • IWG-SEM
  • Projets
    • SPEAR
    • SEWS-D
    • EvIDENz
    • Flood GUIDE
  • Actualités
    • Actualités
    • Événements
    • Événements passés

Breadcrumb

  • Home
  • US Tornado Outbreak Seen From Space: NASA Animation
  • US Tornado Outbreak seen from Space: NASA animation

US Tornado Outbreak seen from Space: NASA animation

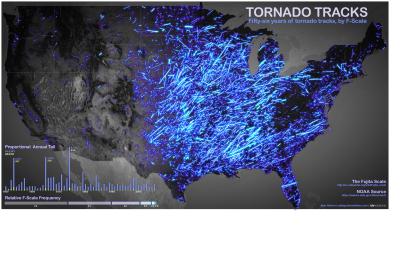
Tracking TornadosTornado Tracks

On 29 April 2014, a new animation of the storm system which spawned 31 tornados affecting seven states across the Central and Southern United States from 27 to 28 April 2014 has been released by NASA using data collected from a NOAA’s GOES East Satellite and NASA’s Aqua Satellite. This data coupled with local weather observations and computer models is able to give forecasters real time information about developing weather situations.

The animation has a run time of 31 seconds. It begins on 26 April 20:15 and runs till 10:15 28 April (local time). The animation illustrates the development and tracks the movement of the storm front.

In order to create the video imagery, NASA and NOAA’s Geostationary Operational Environmental Satellite project (GOES) gather infrared imagery from clouds and overlay this data on true color images created by NASA’s Aqua and Terra Satellites equipped with Moderate Resolution Imaging Spectroradiometer (MODIS) instruments. The overlaid images create complete the picture of the storm system and track its movements. 
NASA
Fri, 2 May 2014 - 17:47

Footer menu

  • Contact
  • Terms of Use

User account menu

  • Log in