
Landslides are a geological hazard which can cause extreme damage to infrastructure and loss of life. They can be defined as the failure of a slope which leads to a variety of ground movements including rock falls and debris flows. Landslides can be induced by a number of extreme weather or geological conditions such as flooding, volcanic eruptions and earthquakes. Severe earthquakes frequently generate widespread landslides, which can cause damage to roads and cut off rivers. For some earthquakes the resulting landslides cause damage that is greater than the initial ground motion. Volcanic eruptions can cause large slope failures while extreme weather events such as typhoons can cause flooding and destabilization of the ground, in turn inducing landslides.
Content
What is satellite based information about landslides used for?
How are landslides mapped from space?
- Landslide hazard preparedness
- Landslide hazard response
- Considerations for selecting appropriate tools
How can I access relevant data?
How is the data used for disaster risk management and emergency response?
What is satellite based information about landslides used for?
As their occurrence is often linked to other natural hazards, satellite data can play a key role in monitoring areas where landslides may occur and in identifying landslide locations for rescue and response missions. A number of countries and international institutions are now using satellite data in order to quickly and effectively create inventory and hazard maps to help combat the risk posed to populations by landslides. The physical cause of landslides cannot be removed, but through effective land use management and engineering practices informed by a combination of satellite, aerial and ground based investigations their hazard can be greatly reduced.
Earth observation technologies are also being increasingly utilized in disaster response situations, for example to direct logistical and emergency support to areas affected by landslides and map the damage they have caused in order to plan for recovery.
Mapping of risk areas and monitoring of landslides can be conducted using satellite and airborne imaging platforms, with new methodologies constantly being developed.
How are landslides mapped from space?
Satellite imagery for landslides can be used in a number of ways; such as for disaster risk reduction through mapping and analysis of areas susceptible to landslides, and disaster response through mapping events shortly after they occur. Landslide hazard mapping and monitoring comprises a number of different tasks including detection, rapid mapping, recording information about the mechanism of failure and long term monitoring. In practice these factors are interrelated and should not be considered in isolation.
In order to select the most appropriate data types and processing techniques to apply in reducing landslide risk and responding to disasters, it is necessary to understand the effects of landslides on the environment in a particular area. In addition, the selection of the optimal technology needs to consider the integration of observation strategies into current risk management strategies within different communities. Landslide event and susceptibility mapping methods are diverse and often vary by landscape, finances available and the purpose of the mapping.
For the assessment of landslide risks and damage, pre- and post-event optical imagery, processed using image analysis and change detection techniques, can be efficient and cost effective. Optical imagery can highlight land cover changes, while LiDAR-derived DEMs can indicate the volume of material moved by erosion processes. Differential interferometric synthetic aperture radar (DInSAR) can detect slow moving landslides, their extent, velocity, and areas susceptible to erosion.
Landslide hazard preparedness
The displacement rate of a landslide is the most critical factor in landslide detection, and in identifying the associated risks and human response. Due to the difficulty of detecting moving landslides, the conventional geomorphological approach of preparing hazard maps through identification of the past occurrence of landslides can be very useful. This can also increase the chance of detecting future moving landslides, and certain areas can be prioritized for remote sensor scanning.
The first stage of mapping a regions’ susceptibility to landslides involves the creation of an inventory of known past landslides. Landslide inventory mapping can be carried out using satellite imagery or aerial photography, overlain on to 10-20m resolution DEMs to allow for 3-D analysis of the landscape. Once a landslide location is known, it is necessary to obtain the landslide characteristics, such as the failure mechanism, the progressions mechanism and the size and kinematics of the failure. This can assist both in rapid mapping and long term monitoring.
In order to assess the probability of a landslide taking place it is necessary to look for specific characteristics that might make a particular location susceptible to one. Assuming that landslides will occur in the future based on the same conditions that produced them in the past, susceptibility assessments can be used to predict the geographical location of future landslides. Various attributes can be grouped into discrete units to analyze the factors that potentially contribute to landslide susceptibility. In the context of landslide susceptibility the attributes are slope, soil type and the measure of overland flow concentration from intense rainfall events. Each specific combination represents a unique condition unit (UCU), a parcel of terrain where a set of attributes are combined in a unique way. If a landslide has occurred in a particular set of slope/soil/flow conditions, then if those conditions occur elsewhere those locations will also be susceptible to landslides. The spatial frequency of landslides can be determined within each unique condition unit through mapping past landslides using remote sensing data and field confirmation if there are sufficient resources available. The probability of landslide occurrence given a unique combination of factors is given by the landslide density in that specific unique condition unit. Areas with similar UCUs can be inferred to have a similar probability of landslides occurring.
However, no single approach has yet been used to map susceptibility for peat, rock and earth slides, both inland and on the coast. The challenge lies in devising a methodology that is applicable to a number of different terrain types using openly available data and low cost methods.
The susceptibility of an area to landslides is likely to change through time with changing conditions, such as changes in soil moisture, pedogenesis, land cover and root development in forested areas. Rainfall varies temporally and spatially and is likely to have an influence on the occurrence of landslides within the landscape. Thus landslide hazard maps need to be continuously updated. The displacement rate of a landslide is a critical factor in the application of particular remote sensing techniques in response to landslides. Some methods may not be sensitive enough to reliably measure very slow displacement, while other methods do not have high enough temporal resolution to monitor faster moving masses.
Landslide hazard response
There are a variety of potential approaches for mapping mass movements using satellite imagery. Passive optical sensors can be used to map landslides but have low (metric) accuracy; however some satellite passive optical sensors such as Landsat, Aster, Spot 1-4, Formosat, EO-1 and DMC have medium resolution and can map landslides larger than a few hundred square meters. The analysis of high resolution satellite imagery is the most useful method for moderate to rapid landslides. The images are frequently obtained from the IKONOS, Quickbird, RapidEye, World-View 2, Pleiades or Geoeye-1 satellites, and used to analyze objects or changes in the images. However displacements have to be noticeable in order to be measured, as temporal resolution is in the range of days, weeks or months between images. The stereo viewing capability of sensors such as TerraSAR-X, ALOSPRISM, SPOT, IKONOS, Worldview-2, and Quickbird as well as the single pass InSAR capability of Tandem-X makes it possible to create detailed digital elevation models, allowing for the calculation of the volume of erosion scars and debris from landslides.
Remote detection of landslides and erosion using optical imagery can be challenging due to the lack of unique spectral signatures associated with mass movement. The presence of exposed soil or a change in vegetation can be identifying factors; however these features are heterogeneous at all spatial scales. In old landslides the ‘sharp’ features rapidly erode and with weathering and re-vegetation the distinctions become blurred. Often the only obvious visible feature remaining will be a slightly round scarp / head region and a hollow, which is difficult to see using satellite imagery.
It is also difficult to use single date spectral information to determine the scale of movement as this does not allow for observation of changes in the landscape. Contextual knowledge of the geology and soils of an area along with multi-temporal data can aid greatly in landslide identification using optical imagery.
Synthetic Aperture Radar (SAR) may often be the first sensor to produce imagery of landslide events due to its ability to map through clouds and at night. The SAR backscatter and resultant imagery depends on the surface dielectric parameters (electrical conductivity) and roughness of the feature being imaged. However a distinct backscatter signature usually cannot be uniquely associated with the mixed and rough features in a landslide such as exposed soils and fallen vegetation. If baseline data is available, then differencing of pre- and post-event backscatter images may detect changes associated with individual landslides. SAR polarimetry may also be a valuable tool for mapping past landslides and erosion in an area due to the sensitivity of radar backscatter to the size, shape, orientation and dielectric properties of the surface on different polarizations. The accuracy of SAR depends on image resolution, and better results are expected to be achieved by higher resolution sensors such as RADARSAT-2, COSMO-SkyMed and TerraSAR-X. Satellite Radar interferometry is very useful for slow or very slow mass movements.
The accuracy of SAR also depends on the similarity of the viewing geometry of the sensor acquiring the imagery; however differences can be partially compensated if an accurate DEM is available. If images are acquired with a large temporal span there will most likely be additional changes in land cover not related to landslides, which may produce false positive signals.
Laser scanning technologies can be used for imaging the relief of landslides with high-resolution digital elevation models. The morphological features of landslides and the areas where channel processes are operating can also be delineated by DEMs created using LiDAR. High resolution DEMs are not yet a common tool for landslide investigations, but new techniques and applications are being developed.
LiDAR and SAR can also provide information on post-event deformation in the event of an earthquake or movement along a fault boundary. Deformation maps are used for modeling of various geophysical processes responsible for this motion and for determining the associated risk of mass movements.
Considerations for selecting appropriate tools
There are a number of factors to take into account in consideration of which specific tools to use for landslide mapping and response. Though ground based techniques are usually of higher resolution, satellite data can have a number of advantages in terms of coverage, accessibility and long term monitoring. Mapping shortly after a landslide is important in sites where the landslide morphology may change quickly, either due to new landslide activity or human intervention. This will allow for a better understanding of the landslide and under what conditions such events may occur in future. It is very rare that ground based systems will be in place when rapid slope failures happen, whereas satellite imagery can be used to assess the post failure state of fast moving landslides at defined intervals.
Cost is a big factor to take into account in selecting a particular technique. There are three types of costs associated with remote sensing; the cost of the input data, the cost of processing and the additional costs for satellite tasking for rapid response. Additional costs for passive space borne data during disasters can be large, but during major disasters particular satellite images can be obtained for free by institutions enrolled in international initiatives such as the ‘International Charter for Space and Major Disasters’, the COPERNICUS Emergency Management Service and Sentinel Asia.
The temporal resolution should also be taken into account and details the revisiting time of remote sensors. The greater the temporal resolution, the greater the chance to detect sudden changes in the landscape.
Coverage should also be considered when selecting the most adequate technique, which can be expressed in terms of its range or a typical value of the swath width or area covered during a single pass of a satellite. Space borne medium resolution passive optical sensors such as Landsat, Aster, Spot, EO-1 and DMC are capable of achieving large coverage, in the range of thousands of km2. Use of such satellites is preferable in regional scale studies rather than site specific applications.
Space borne remote sensing is an important tool for the detection of active and dormant landslides over wide areas, especially where the terrain characteristics make direct site access difficult. Acquired imagery can be used to prioritize areas for further investigations and for long term monitoring if there is a high probability of recurrent landslides. This can then be used to implement early warning systems and check the effectiveness of remedial measures.
How can I access relevant data?
Factors that influence the rate and scale of landslides include the ground cover and vegetation type, topographic factors such as slope and aspect, climatic effects and soil characteristics, such as the degree of compaction and organic matter. There are a number of different landslide types, including falls, topples, rotational slides, translational slides, flows, and complex and compound landslides. This has led to a number of methodologies for the identification and characterization of landslides, and a number of data types that are useful for different situations, such as precipitation, land cover and soil moisture data.
The availability of relevant data will be dependent on the stage of the disaster cycle being mapped, the region in question and finances of stakeholders. Higher resolution data may not be available, and temporal resolution may vary widely.
In the case of landslide risk mapping, orthographic photos, aerial imagery and satellite data may be available from the geological survey of a region or country. In the case of a disaster taking place, a number of organizations will make relevant satellite data and crowd sourcing information available for mapping of landslide locations, such as the Pacific Disaster Center, German Aerospace Center, Copernicus Emergency Management Service, and the International Charter on Space and Major Disasters will be activated. The USGS also operates a Hazard Data Distribution System which compiles satellite imagery for the area in which the disaster has occurred.
For rapid response to disastrous events, there can be additional costs associated with satellite programming, in comparison to operationally acquired datasets.
Links to data:
SAR data:
- Cosmo-Skymed/SAR satellite imagery (ESA); this can be used for multiple natural hazards and is free with some restrictions (Link to data).
- Envisat/ ASAR imagery is available for free from the ESA, with some restrictions (Link to data).
- RADARSAT – 1&2/SAR imagery is available with limitations through the Canadian Space Agency (Link to data).
- Sentinel-1 satellite imagery and aerial imagery can be obtained freely from the ESA (Link to data).
- Terra-SAR-X imagery is available for free with restrictions; however DLR gives limited access to Principal Investigators upon submission of a project proposal (Link to data).
Optical imagery:
- SPOT imagery, including satellite and aerial imagery, is available free with restrictions, for example with the submission of a project proposal (Link to data).
Digital Elevation Models:
- A number of Digital Elevation Models are available for free from various sources (DEM SRIM 3, NASA) (SRIM 4.1, CGIAR-CSI) (SRIM X-band, DLR)
- For an overview of digital elevation models see data application of the month on digital elevation models (Link to the data application).
Precipitation data:
- ITHACA provides an extreme rainfall detection system (Link to data).
- There are a number of providers of free rainfall estimation data, both globally and regionally, for example NASA TRMM (Link to data).
- For an overview of precipitation see data application of the month on precipitation (Link to the data application).
Soil moisture data:
- The European Space Agency has a free data set of global soil moisture between 1978 and 2010 (Link to data).
- For an overview on soil moisture data see data application of the month on soil moisture (Link to data application).
Land cover data:
- The International Steering Committee for Global Mapping (ISCGM) provides freely available export data of global land cover, via the Global Map-Global Land Cover (GLCNMO) (Link to data).
- The USGS Earth Explorer also provides land use and land cover data for free (Link to data).
- For an overview on land cover data see data application on land cover (Link to data application).
Landslide hazard specific data:
- The USGS Earth Explorer provides baseline and hazard specific data freely, including export data and maps and data visualizations (Link to data).
- Global Landslide hazard specific data is available for free from the Center for Hazards and Risk Research (Link to data).
- Data from the Hazards Data Distribution Explorer from the USGS is available for free with restrictions. (Link to data).
- NASA has a web map of potential landslide locations (Link to data).
- Global rainfall induced landslides by NASA (Link to the data).
How is the data used for disaster risk management and emergency response?
Case study for disaster risk management
There are a number of examples in both the academic literature and from country level risk management institutions of satellite data being used to help create landslide inventory maps, hazard maps and susceptibility maps. The method of creating unique condition units to define areas of higher probability of land sliding described in section 2 above ("How are landslides mapped from space?") has been used for example by the Geological Survey of Ireland (GSI, 2013), in the Northern Italian Appenines (Clerici et al., 2002), the Cekmece area of Turkey (Duman et al., 2005) and Serchio River Valley in Italy (Federici et al., 2007).
A study was carried out by Agostini et al (2013) on the use of remote sensing for landslide studies in Europe. They found that the majority of end users and researchers involved in disaster risk management used a combination of optical, radar and aerial imagery to map landslides, and used satellite radar for landslide monitoring. Remote sensing data was used for the detection and mapping of landslides over a large scale and integrated with geological maps and Digital Terrain Models to give a clearer insight into the causal factors of the landslides.
A landslide geodatabase including a landslide inventory map was created for the Messina Province in Italy using remote sensing by Ciampalini et al (2014). Italy is strongly affected by landslides which cause significant casualties and economic damage. In the Messina Province, landslides are recurrent and of high magnitude due to the morphology and lithology of the area, along with active tectonics and high intensity rainfall events. The geodatabase was created using SAR satellite ERS1/2, ENVISAT, RADARSAT-1, TerraSAR-X and COSMO-SKYMed data along with in situ measurements using GBInSAR. These advanced monitoring techniques were used to monitor long term slope deformation and delineate areas of high susceptibility. The data was used to produce a number of landslide susceptibility and risk zonation maps which are in use by the Civil Protection authorities to manage risk in the region.
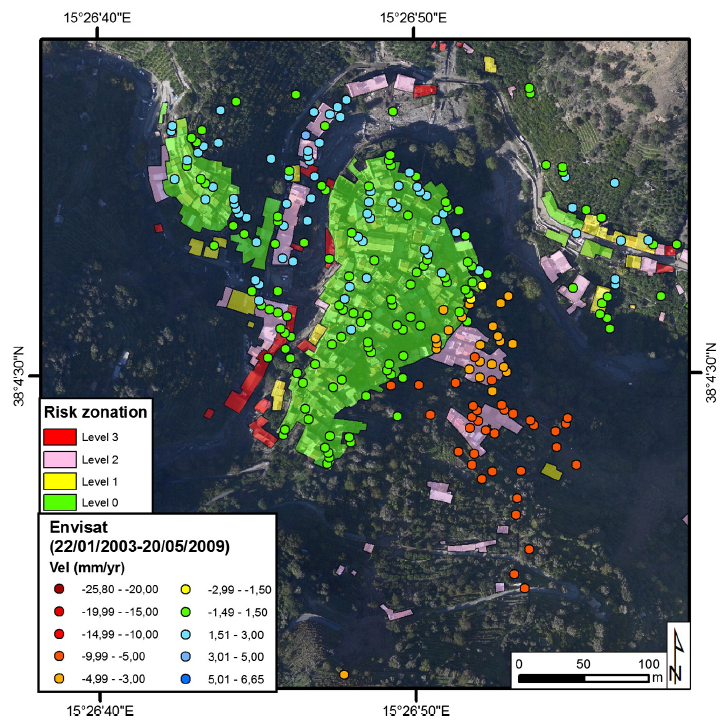
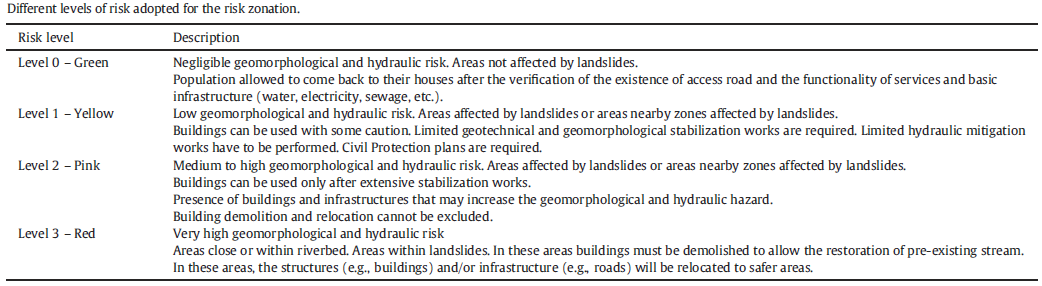
Figure and Table: Landslide risk zonation for the Altolia village (Messina). The four risk levels were decided following the description of the table (above) considering buildings characteristics (damages and distance from the riverbed) and the detected ground deformation velocity by SAR sensors. Light blue arrows correspond with the main flow directions of the Giampilieri and Mandarina creeks. Source: Ciampalini, A., et al., Remote sensing as tool for development of landslide databases: The case of the Messina Province (Italy) geodatabase, Geomorphology (2015), http://dx.doi.org/10.1016/j.geomorph.2015.01.029
Case study for emergency response
Following the 7.8 magnitude Earthquake in Nepal on the 25th of April 2015, due to the mountainous topography of the area a large number of landslides occurred. The earthquake induced landslides were a significant hazard to the population of Nepal and resulted in a high number of casualties.
Satellite imagery was used extensively for the region in order to help assess needs and areas of interest for emergency response teams, identify blocked roads and infrastructure damaged by landslides and potentially unstable areas. The satellite data provided broad coverage of a number of inaccessible areas, and a number of institutions such as the Pacific Disaster Centre created landslide maps of Nepal using satellite imagery and precipitation data.
A NASA sponsored team of scientists used satellite images to identify landslide locations, characterize additional hazards such as dammed lakes and to create hazard maps. Data sources included Landsat satellites, EO-1, ASTER, WorldView and GeoEye Satellites and topographic information accessible in Google Earth. A number of methodologies were used by different teams of scientists, for example using pre- and post-event imagery from RADARSAT-2. Other groups such as Digital Globe and HOT-OSM used crowd sourcing to rapidly map landslides from satellite images with the help of thousands of volunteers around the world.
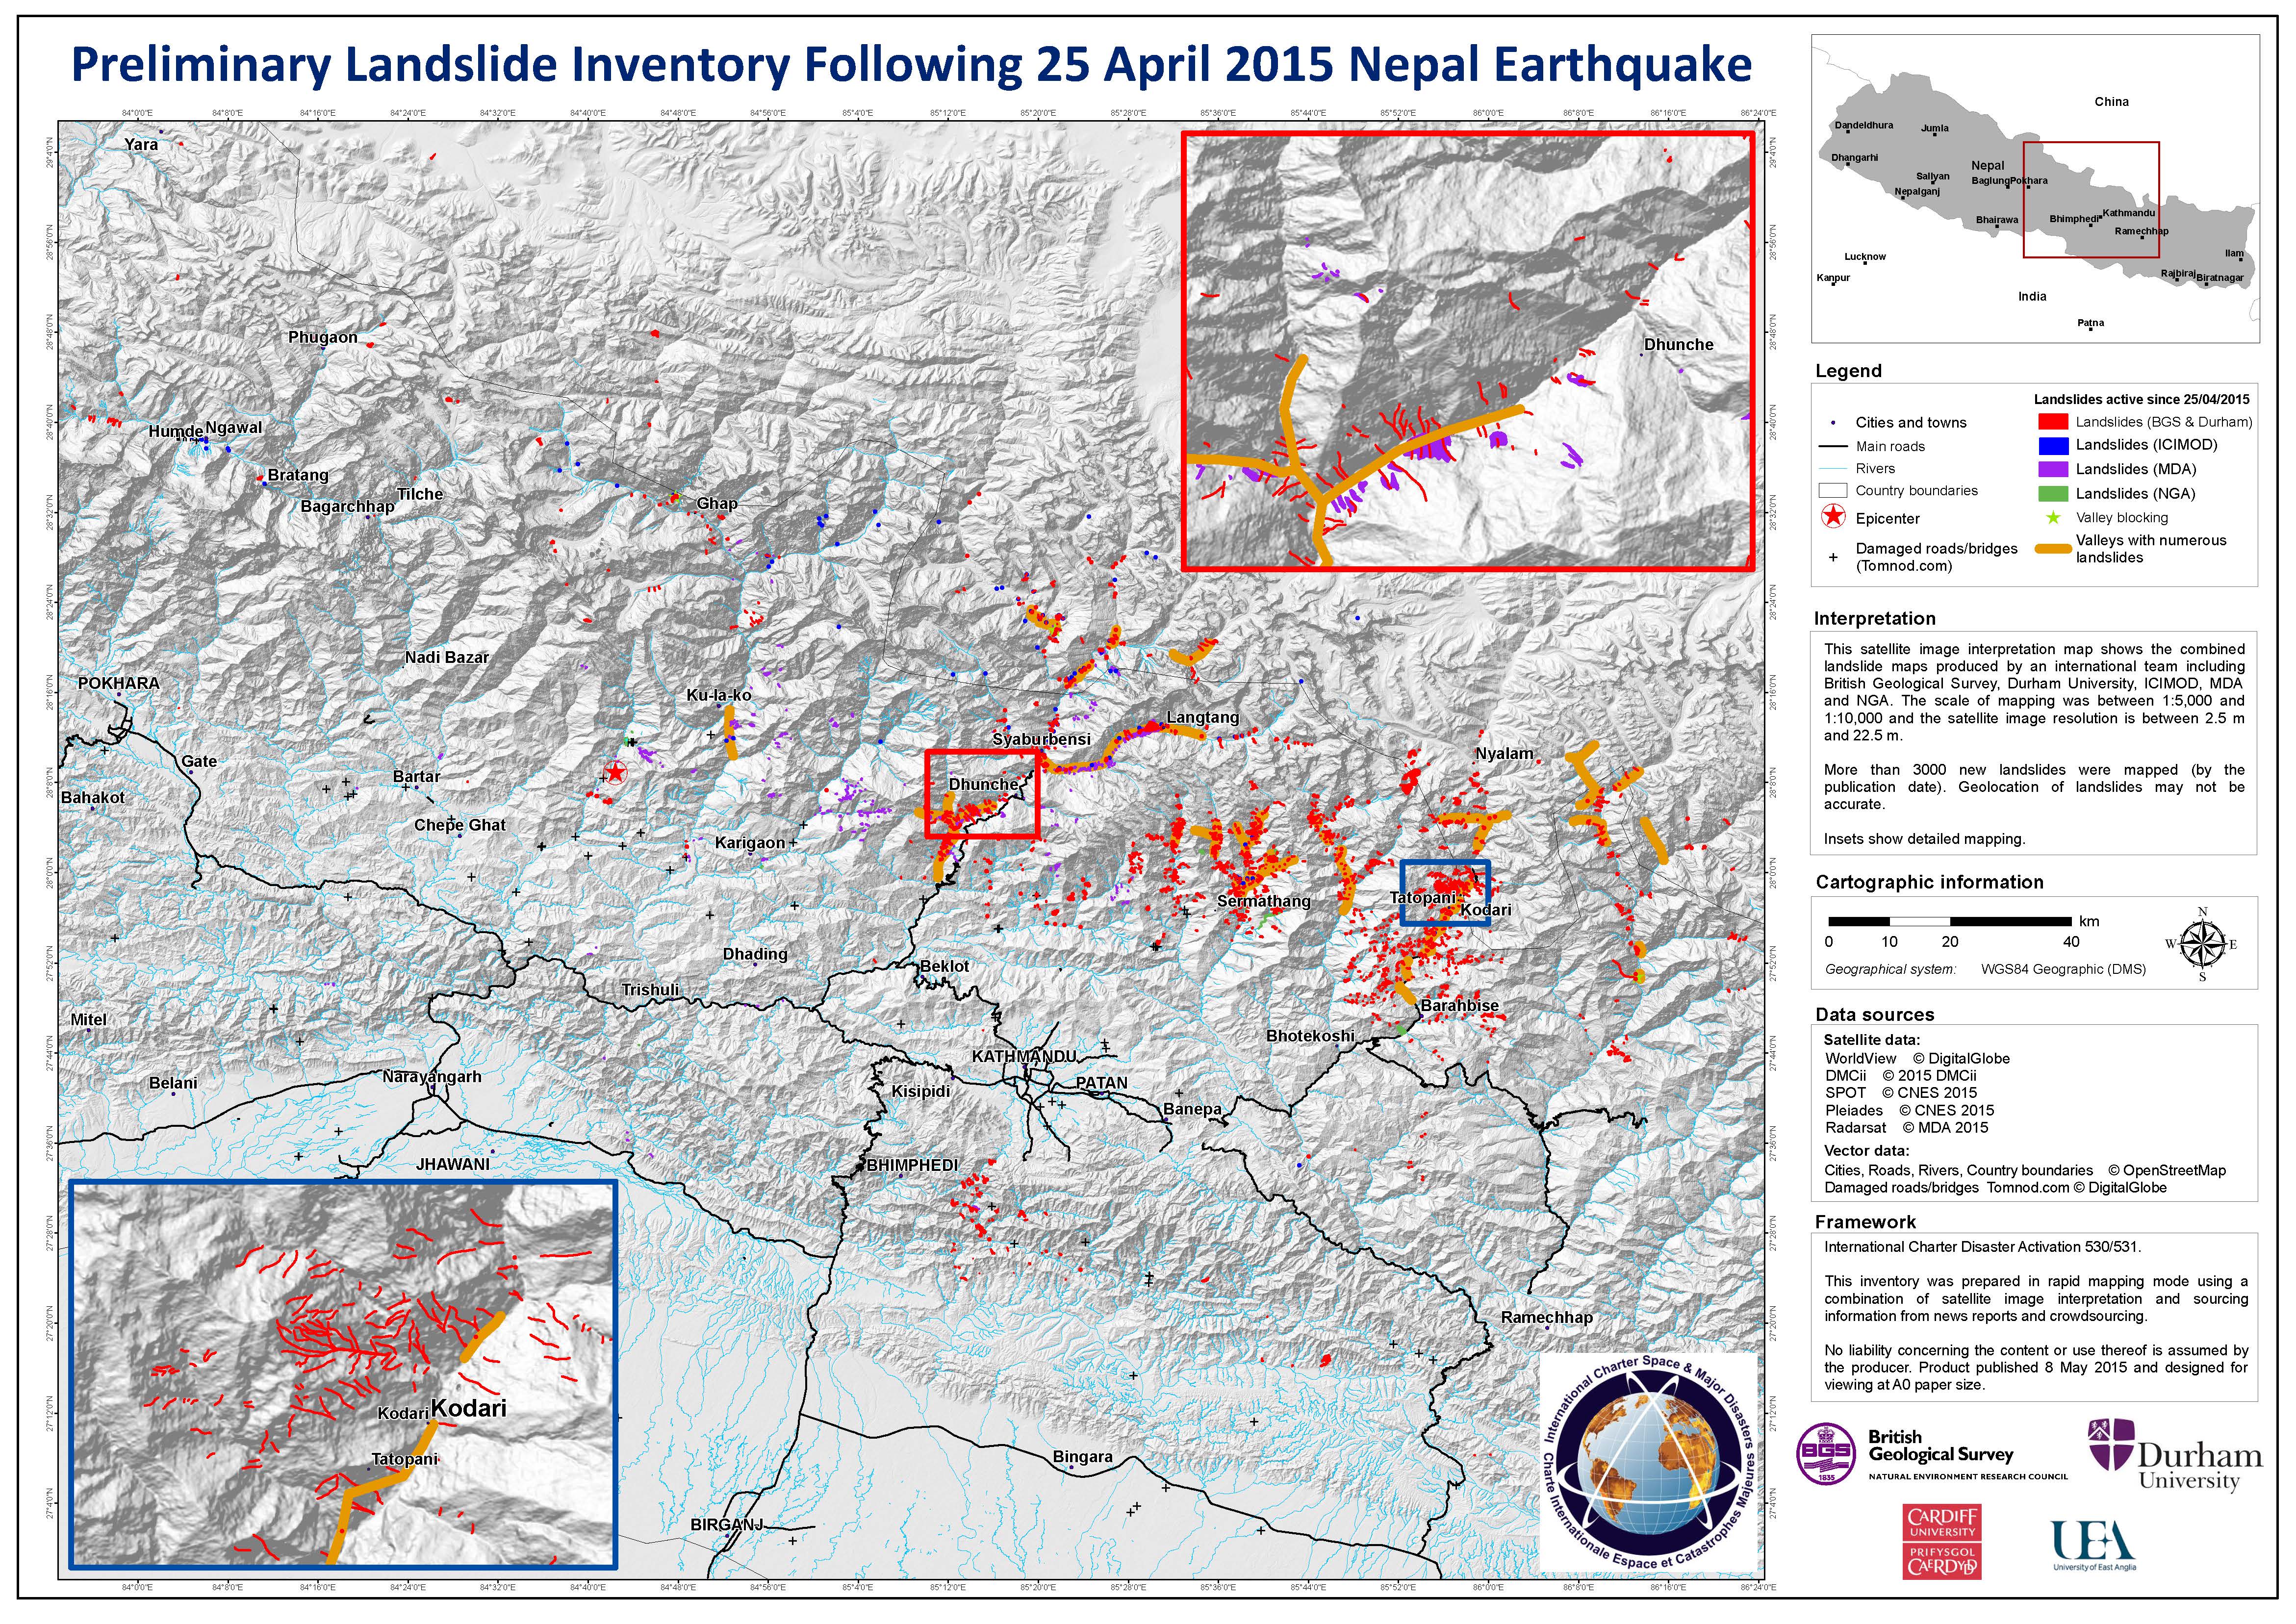
Figure: Nepal earthquake landslide inventory. Source: International Charter on Space and Major Disasters.