![]()
United
Nations
Tremblement de terre
 Earth Observation Center (EOC) using data acquired by Sentinel-1A before and after the earthquake event. Image: DLR/EOC")
Definition
Facts and figures
Further information
UN-SPIDER Regional Support Offices with hazard-specific expertise
Related content on the Knowledge Portal
Consists of:
- Heat and Fire Expo Asia
- "The Heat and Fire Expo Asia is the innovative exhibition and conference designed to support the mitigation for one of the most costly natural disasters in the World by showcasing the latest revolutionary global solutions."
- Earthquake Expo Asia
- "The Earthquake Expo Singapore is the most innovative exhibition and conference dedicated to supporting the mitigation of one of the world’s most devastating natural disasters."
- Flood Expo Asia
- "The Flood Expo Asia is the ultimate innovative exhibition and conference designed specifically to support the mitigation of the most costly natural disasters in the region, by showcasing the global solutions available today that will…
- Heat and Fire Expo Asia

Consists of:
- Heat & Fire Expo
- "The Heat & Fire USA is the leading wildfire prep, management, and recovery event, showcasing the latest tools, strategies, and insights among investment and global industry leaders."
- Earthquake Expo
- "The Earthquake Expo USA is the leading seismic prep, management, and recovery event, showcasing the latest tools, strategies, and insights among investment and global industry leaders."
- Flood Expo
- "The Flood Expo USA is the leading flood prep, management, and recovery event, showcasing the latest tools, strategies, and insights among investment and global industry leaders."
- …
- Heat & Fire Expo
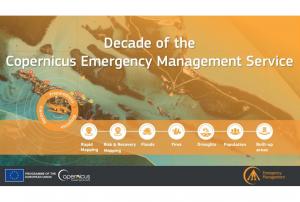
Implementing science to save lives: A Decade of the Copernicus Emergency Management Service
The Copernicus Emergency Management Service (CEMS) celebrates a decade of operation as a world leader in emergency mapping, early warning tools and open-access disaster information.
For the past ten years, CEMS has provided a global service as a fully operation emergency mapping service at no cost to users and with open access data.
Some highlights on the contribution of CEMS in global disaster risk management activities:
- 576 Rapid Mapping Activations with 5,500+ maps delivered
- Designed and implemented the world’s first Global Flood Monitoring tool
- Ten years of wildfire forecasts up to ten days into the future
- Average of 200+ flood and 500+ flash flood notifications to Member States and authorised users each year
- Offers a current and historical database of 7,000+ drought episodes since 1950
…
read more22/06/2022 The Copernicus DEM is a Digital Surface Model (DSM) which represents the surface of the Earth including buildings, infrastructure, and vegetation. The Copernicus DEM is provided in 3 different instances. Two worldwide coverages at 90m (GLO-90) and 30m (GLO-30) resolution are openly available to the public for download via the PANDA Catalogue and FTP. A further European coverage (EEA-10) is provided at 10m resolution, but data is restricted to eligible users who meet required access rights.Publishing institution:
-
The Copernicus DEM is a Digital Surface Model (DSM) which represents the surface of the Earth including buildings, infrastructure, and vegetation. The Copernicus DEM is provided in 3 different instances. Two worldwide coverages at 90m (GLO-90) and 30m (GLO-30) resolution are openly available to the public for download via the PANDA Catalogue and FTP. A further European coverage (EEA-10) is provided at 10m resolution, but data is restricted to eligible users who meet required access rights.Publishing institution:
 Publishing institution:
 Publishing institution:
 The Copernicus Open Access Hub provides complete, free and open access to Sentinel missions data.Publishing institution:
The European Space Agency is organising the 10th International Workshop on Science and Applications of SAR Polarimetry and Polarimetric Interferometry, POLINSAR 2021.
Date(s)
The workshop will take place online from 26 to 30 April 2021.
Objectives
- Provide a forum for scientific exchange
- Present the latest exploitation results from full-pol airborne and spaceborne systems and assess the state-of-the-art
- Review retrieved bio-geophysical parameters and their accuracy
- Make recommendations for algorithm development and new products
- Support the preparation for ESA and Third Parties full-pol missions exploitation (BIOMASS, NOVASAR-S, RCM, SAOCOM, TerraSAR-L etc.)
- Present innovative polarimetric applications and ideas for future polarimetric mission concepts Report on the status of POLinSAR 2019 recommendations
Sessions…
read more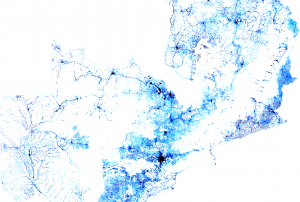 Facebook Connectivity Lab in collaboration with the Center for International Earth Science Information Network (CIESIN) at Colombia University combines machine vision AI with satellite imagery and census information to create population density maps. With the integration of demographic information, specifically related to age and gender, these maps collectively provide information on both the location and the demographic of a population in a certain country. The population density maps cover the majority of countries around the world.Publishing institution:
UN-SPIDER Regional Support Offices with hazard-specific expertise
![]()