Technological Trends in Remote Sensing
Significant technological advances and substantial reductions in the costs of operating satellites, launch services, supporting infrastructure, data storage and transmission technologies have led to a dramatic rise in the availability of satellite imagery for civilian use in recent years. This rise in availability of satellite imagery stems from a larger number of satellites launched into orbit by space agencies from many countries of the world and some private companies. This rise is allowing for higher re-visit times over the same geographic area in most regions of the planet.
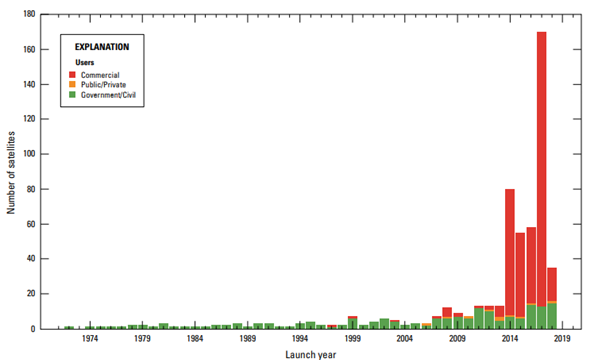
In a complementary fashion, since Landsat was first launched in 1972, optical remote sensing has advanced from simple 3-4 band visible and near-infrared (NIR) to multispectral, hyperspectral, and spaced-based active remote sensing, which has dramatically expanded the potential for utilising Earth Observation (EO) data across a range of applications (Christopherson, Chandra & Quanbeck, 2019). You can read more about free satellite data and how to access it here, and find out how satellite data can be applied in support of disaster management and emergency response in the Knowledge Portal’s Data Applications of the Month and Recommended Practices.
Until recently, to tap into the archives of multi-spectral archived and up-to-date imagery acquired by a variety of sensors in satellites over many years, users needed to log into different websites or portals that hosted such imagery and had to use specialized software to develop procedures to generate geospatial data for different applications. To facilitate use of the huge inventories of satellite imagery, specialized database infrastructures called Datacubes are being developed in many countries of the world. These Datacubes are emerging out of major advances in increasing computing power and native cloud infrastructures and are offering collective processing power and storage services to leverage the widespread use of space-based information through Analysis-Ready Data (ARD) products. Data Cubes are revolutionising the way we handle huge geospatial and EO datasets and leveraging faster, cost-effective ways to facilitate the analysis of remote sensing imagery at scale, by driving data straight into the hands of wider audiences and policy makers to support decision making. Essentially, all data is provided to end users with all the pre-processing steps completed, in contrast to individual users undertaking many steps including data search and download from different portals, clipping/reprojecting/mosaicking, and many preparatory corrections before the image(s) can be accurately used.
Open-source data cube infrastructures have been highlighted as a potential solution to facilitate disaster risk reduction efforts and address significant technical barriers, including data preparation, distribution, and management of increasingly large spatio-temporal-spectral archives from multiple sensors, to maximise the exploitation of our growing satellite resources (Cheng et al, 2020). By lowering the burden of EO data preparation and enabling end users to rapidly query and analyse very large volumes of data through an integrated platform, open data cubes can increase the feasibility of tackling disaster risk reduction and monitoring disaster impacts at regional and national scales, accelerate the development of open-source algorithms, and advance the progress of emergency requests for EO information in support of disaster management (Cheng et al, 2020). Data Cubes are therefore a powerful and promising tool to promote the utilization of EO data and optimise the efficiency of generating satellite-derived disaster information products which provide crucial insights to support policy and decision-making during all phases of the disaster cycle (Cheng et al, 2020).
ARD is a core concept of an EO data cube and is the key to facilitate the analysis and interpretation of spaced-based data by non-expert users. The Committee on Earth Observation Satellites (CEOS) has defined Analysis Ready Data for Land (CARD4L) as “satellite data that have been processed to a minimum set of requirements and organized into a form that allows immediate analysis with a minimum of additional user effort and interoperability both through time and with other datasets” (Siqueira et al, 2019). For example, data may be delivered as normalised surface reflectance measurements for optical data, or normalised radar backscatter for radar images (Siqueira et al, 2019).
The Data Cube Concept
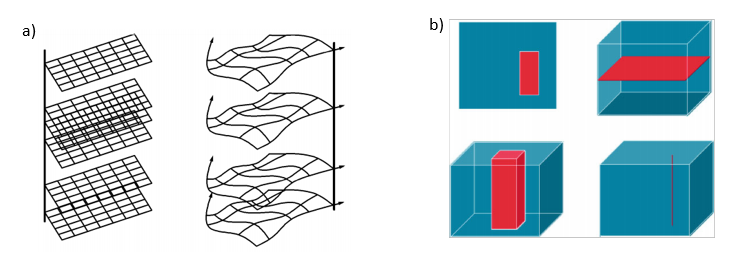
A data cube simply describes a multi-dimensional array of values of n-dimensions. In compliance with operational standards established by the International Organization for Standardization (ISO) and the Open Geospatial Consortium (OGC), data cubes belong to the category of coverages, and the OGC Community Practice has defined such a data cube as “established on the basis of a Coverage with a specific grid system for geospatial data with at least one dimension of spatial or temporal definition” (OGC, 2020). ARD is then fundamental to the EO data cube, which integrates this data into one logical array (such as 5-D x/y/z/t/b for image timeseries, integrating geographic location and elevation (x,y,z), time (t), and band of the electromagnetic spectrum (b), so that data are “stacked” by time of acquisition) to enable both spatial (horizontal and vertical) and multi-temporal analysis.
The Australian Geoscience Data Cube (AGDC) was the world’s first EO data cube, conceived by Geoscience Australia and developed in collaboration with a number of organisations over several years. It originated as an initiative to maximise the impact of the Landsat land surface image archives which had been acquired over the Australasian region by successive Landsat missions since Australia’s first participation in the program in 1979 (Lewis et al, 2017). The AGDC was relaunched as version 2 (AGDCv2) in 2017, and evolved into the Digital Earth Australia (DEA) implementation of the Open Data Cube (ODC), a global initiative adopted by CEOS to provide a freely accessible solution to streamlining satellite data distribution and management for providers, whilst lowering technical barriers for operational users, particularly in developing countries.
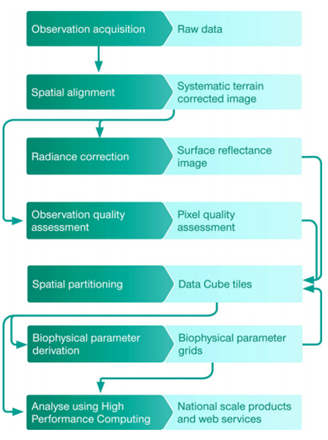
The AGDC was designed to address the “three V’s” of Big Data challenges, namely, Volume, Velocity and Veracity, and with further consideration of Variety, for integrated management, traceability, and improved extraction of timely and relevant information from growing data volumes (Lewis et al, 2017). Protocols were therefore implemented in consideration for the need of high calibration of satellite observations, delivery of standardised basic measurements, and accurate geo-location. Geometric and radiometric corrections provide ARD corrected for a range of variations in observing conditions and inter-sensor differences, to ensure multi-sensor pixel spatial alignment and delivery of gridded measurements of normalised surface reflectance, so that observations are comparable through time and space. Quality assessment and quality flags applied at the dataset and pixel level allow users to identify undesirable observations for specific applications without discarding entire scenes, to minimize the loss of useful observations. Data are then indexed or ingested as multi-dimensional datasets by spatially partitioning the data into tiles and packaging them into netCDF files before products are derived from the data cube (Lewis et al, 2017). You can read more about the development of this data cube which is described in an open-access paper accessible here.
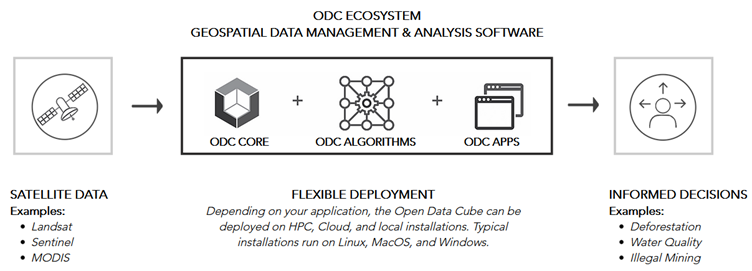
The ODC is being used to meet the targeted needs of users at a global level to maximise the impact of EO data and address the “scaling” challenge in many economies, represented in terms of limited access to data download, data preparation, and efficient analyses of satellite imagery. At its core, the ODC is a set of Python libraries and a PostgreSQL database that helps you work with geospatial raster data (ODC, 2020). It allows for flexible deployment (local to cloud) of its freely accessible data exploitation architecture and facilitates the sharing of code, tools and algorithms. The ODC can catalogue large amounts of data from any satellite data provider, which are customarily stored in GeoTIFF or NetCDF file formats but can include anything that can be read by GDAL (Leith, 2019). The ODC then serves as a bridge between data and applications, featuring a suite of open source-tools and a Python based API enabling high performance data access and querying, and applications including ready-to-run scientific analyses in the form of Jupyter Notebooks (ODC, 2020).
Example Applications
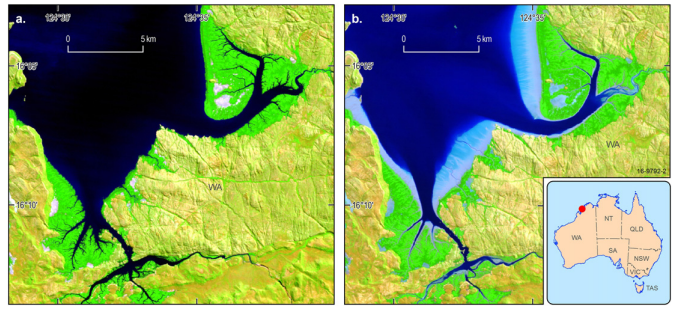
The characteristics of the DEA described above have allowed for the development of automated workflows for continental scale characterisation of the land surface, coasts, and oceans through time, and respond to the demand for near-real time access to full archives of moderate resolution satellite data for applications including time-series analysis techniques to detect change, and the use of clear pixel composites for accurate analyses over regions experiencing high cloud frequency (Lewis et al, 2017). For example, scientists have used the DEA to produce ‘best available pixel’ composites of the high-tide and low-tide maximum extents over an estuarine area in Australia by drawing on a 28-year time series of Landsat observations from 1987 to 2006. Median surface reflectance values corresponding to the highest and lowest 10% of observed tides were selected for the generation of the summary layer mosaics of the estuary at different biophysical states. The methodology has served as the basis for the creation of a national intertidal map product for improved monitoring of Australia’s coastline and demonstrates the clear advantages of harnessing the architecture of the data cube to map dynamic ecosystems over relying on analyses using a small number of individual satellite images (Lewis et al, 2017).
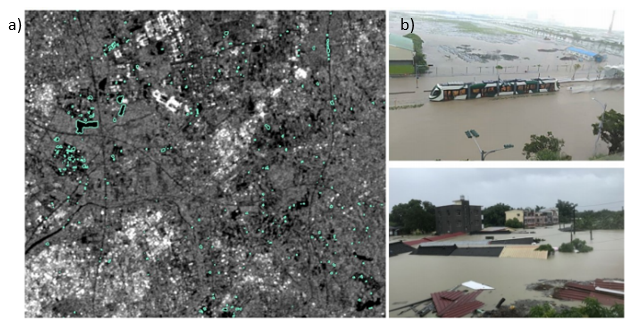
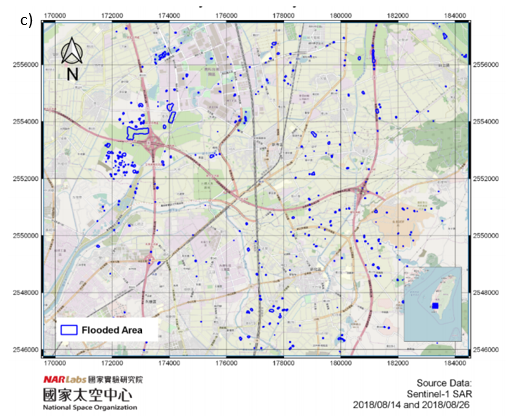
The Taiwan Data Cube (TWDC) is an implementation of the ODC with an ARD data archive from sensors including Sentinel-1, Landsat 7, Landsat 9 and two FORMOSAT satellites managed by the National Space Organization (NSPO), part of the National Applied Research Laboratories (NARLabs) in Taiwan. TWDC is being developed to address disaster risk reduction at a regional and national scale, which is exemplified by the development of TWDC-derived disaster information products which will support the efforts of Sentinel Asia, an international co-operation platform and emergency mechanism contributing to disaster management in the Asia-Pacific region (Cheng et al, 2019). For example, the application of TWDC in disaster response due to floods was demonstrated using Sentinel-1 data for the rapid generation of a map of an urban area that was inundated. Following a period of extreme rainfall and flooding in southern Taiwan on August 26th, 2018, multitemporal radar backscatter differencing was applied on two Synthetic-aperture radar (SAR) images acquired on the 14th and 26th August, 2018, respectively (Cheng et al, 2019). As the backscattering coefficient of water typically exhibits lower values relative to other land objects as a result of its reflectance properties in the microwave spectral range, the flooded and non-flooded area could be extracted by applying a threshold on the difference in backscatter between the pre an post-flood images (Cheng et al, 2019).
Data Cube Implementations
EO data represents an extremely valuable source of information to support decision makers across all aspects of society, including addressing the United Nation’s Sustainable Development Goals (SDGs), and the Sendai Framework for Disaster Risk Reduction 2015-2030 (ODC, 2020). By automatically ingesting and processing data from multiple sensors to ARD, including correcting for noise, solar and view angle, topography, radar incidence angle and the atmosphere, the time and cost of using EO data is being reduced. Data cubes are therefore shifting the focus of analysts collating and pre-processing raw datasets, to developing innovative applications.
Data Cubes can be categorised as open data cubes, which provide a freely accessible exploitation architecture, or private and commercial services, which generally work as partnerships between industry leading companies, such as the Euro Data Cube and Sentinel Hub, which provide data access, processing power and cloud workspace. The open-source ODC solution has the ability to be implemented on diverse computational infrastructures, such as Australia’s National Computation Infrastructure, the supercomputing facility that facilitated the development of AGDC, through to commercial cloud infrastructures (Dhu et al, 2019). Data cubes are being established at regional and national scales, but they may also be developed for specific applications. For example, iMMAP, an international not-for-profit organization that aims to provide information management services to humanitarian and development organizations, is undertaking work to develop a Middle East and North Africa (MENA) Analysis Ready Data Cube (ARDC) based the ODC infrastructure to address the needs of the humanitarian sector, including disaster monitoring of floods, wildfires and landslides. You can read more about the initiative here, which will be deployable over any region of the world but will initially focus on countries in the MENA region such as Syria, Jordan, Lebanon and Iraq.
Whilst individual country-level data cubes will support national policy and decision-making, the development of regional data cubes (such as Digital Earth Africa) will allow for transboundary issues relevant to regional policy and planning needs to be addressed (Dhu et al, 2019). This latter type of data cube may be especially important for managing all phases of the disaster cycle, as hazards and their impacts are often not constrained to within country borders and may require regional collaboration and planning to address. Examples of regional and national open data cubes already implemented and/or under development include:
• Brazil Data Cube (under development since January 2019): Under development by Brazil’s National Institute for Space Research (INPE), the project aims to create multi-dimensional data cubes to facilitate the extraction of land use and cover information using machine learning and satellite image time series, and support the Brazil Biome Monitoring Program. The Brazil Data Cube aims to create ARD from medium-resolution satellite imagery over all Brazilian territory from Landsat, Sentinel and the China-Brazil Earth Resources Satellite program (CBERS) collections.
• Colombian Data Cube (CDCOL): An implementation of the ODC launched in 2016, developed by the Instituto de Hidrología, Meteorología y Estudios Ambientales (IDEAM) and the University of the Andes. CDCOL is enabling users from Colombian institutions to develop algorithms, run analysis and create products from large EO datasets. Its primary objectives are to support national-scale forest monitoring and land change detection. You can register here.
• Digital Earth Africa (DE Africa): In 2020, DE Africa transitioned from the African Regional Data Cube (launched 2018, and initially supporting five countries in central Africa: Kenya, Senegal, Sierre Leone, Ghana and Tanzania) to increase the project’s scalability and functionality to a fully operational data and information infrastructure providing advanced continental-scale services, datasets, and products. DE Africa is providing decades worth of ARD data from Landsat 5, 7 and 8, Sentinel-1 and Sentinel-2 collections in compliance with the CARD4L framework. DE Africa uses Cloud Optimised GeoTIFFs to enable more efficient workflows on the cloud and SpatioTemporal Asset Catalogue (STAC) specification metadata so that data are more easily indexed and discovered. Improved understanding of Africa’s changing landscape will support decision-makers with insights and knowledge at all levels (from governmental to local businesses and farmers), to support the monitoring of the UN’s SDGs and address issues relating to agriculture, food security, deforestation, urbanization, water access, and more.
• Mexican Data Cube (under development): An implementation of the ODC under development by the Instituto Nacional de Estadística y Geografía (INEGI) to address the technological and infrastructural challenges that limit the processing and integration of EO data into national-level processes. The data cube will improve the detail of and timely delivery of national maps and will be orientated towards supporting priority local and global agendas, in particular calculating SDG indicators. Products under development include Geomediana Landsat for the production of continuous, cloud-free summary mosaics which preserve spectral relationships allowing for the extraction of spectral indices, and the Water Observations from Space (WOfS) algorithm (developed in Australia) for calculating the percentage of clear observations in which surface water is detected (Juárez Carrillo et al, 2020).
• Swiss Data Cube: An implementation of the ODC operated by UN Environment/GRID-Geneva and the University of Geneva to support environmental monitoring, reporting, and improved knowledge of the Swiss environment using EO data and quantitative information products. The Swiss Data Cube now has a six-terabyte ARD archive spanning 35 years and approximately 10,000 images from Landsat 5, 7, 8 (1984-2017), Sentinel-1, and Sentinel-2 (from 2015). Applications of the Swiss Data Cube have include the development of the the Snow Observations from Space (SOfs) algorithm for monitoring snow cover and variability across the country, which is essential for water-source management and has important implications for managing flood risk (Dhu et al, 2019).
• Uganda DFMS: Operational since 2019 and planned for trial until 2022, the Drought and Flood Mitigation Service (DFMS) project is based on ODC technology. The project is funded by the UK Space Agency and led by the RHEA Group in partnership with a number of Ugandan and UK-based project partners. The focus of DFMS will be on mitigating the impacts of drought and floods, reducing the impacts of climate change on Ugandan society, and increasing the impact of data collection and processing for the generation of information and knowledge which will be provided to decision-makers in Uganda to support this goal. Products will include forecast (such as 2 and 7-day hydrological runoff) and monitoring and analysis services (such as soil moisture and evapotranspiration changes) based on satellite imagery covering the whole of the country.
Further ODC country implementations currently under development include data cubes for Vietnam, Georgia, Moldova, the U.K, and U.S. You can find out more the ODC’s planned “Road to 20” International Data Cube Deployments by 2022 and prospective country data cubes under review here.
References
- Cheng, M-C., Chang, L-Y., Kawakita, S., Chen, B., Liu, C., Lin, H-C., Lin, L-C (2020). ‘Development of Open Data Cube to Facilitate Disaster Risk Reduction’. IGARSS 2020-2020 IEEE International Geoscience and Remote Sensing Symposium, 26 Sept-2 Oct 2020. DOI: 10.1109/IGARSS39084.2020.9324214.
- Christopherson, J.B., Ramaseri Chandra, S.N., and Quanbeck, J.Q. (2019). 2019 Joint Agency Commercial Imagery Evaluation—Land remote sensing satellite compendium: U.S. Geological Survey Circular 1455, 191 p., https://doi.org/10.3133/cir1455.
- Dhu, T., Giuliani, G., Juárez, J., Kavvada, A., Killough, B., Merodio, P., Minchin, S., Ramage, S (2019). ‘National Open Data Cubes and Their Contribution to Country-Level Development Policies and Practices’. Data, 4(4):144, https://doi.org/10.3390/data4040144.
- Juárez Carrillo, O.J., Merodio Gómez, P., del Socorro Ponce Medina, M., Ornelas de Anda, J.L., Coronado Iruegas, A.A (2020). ‘Cubo de datos geoespaciales para el uso de las imágenes satelitales en la generación de información geográfica y estadística’. Realidad, Datos y Espacio, Revista Internacional de Estadística y Geografía, 11:3, pp. 124-139.
- Leith, A (2019). What is the Open Data Cube? Medium blog post. Accessible via: https://medium.com/opendatacube/what-is-open-data-cube-805af60820d7 (accessed on 21/05/2021).
- Lewis, A., Oliver, S., Lymburner, L., Evans, B., Wyborn, L, et al. (2017). ‘The Australian Geoscience Data Cube-Foundations and lessons learned’. Remote Sensing of Environment, 2020, 276-292, http://dx.doi.org/10.1016/j.rse.2017.03.015.
- Open Data Cube (2020). Overview. Accessible via: https://www.opendatacube.org/overview (accessed on 21/05/2021).
- Open Geospatial Consortium (2020).Geospatial Coverages Data Cube Community Practice. Version 1.0, OGC Document 18-095r7. Available at: https://www.ogc.org/docs/cp.
- Siqueira, A., Lewis, A., Thankappan, M., Szantoi, Z., Gory, P. et al. (2019). CEOS Analysis Ready Data for Land-An Overview on the Current and Future Work. IGARSS 2019 - 2019 IEEE International Geoscience and Remote Sensing Symposium, pp.5536-5537.DOI: 10.1109/IGARSS.2019.8899846.