This user story has been originally published on the UNOOSA Space4Water Portal
In 2019, floods caused 43.5% of all deaths due to natural disasters and thereby represent the deadliest type of disaster with an increasing number of events compared to previous years (CRED, 2019). Floods furthermore lead to the highest number of people affected compared to other disasters as they affect human activities and the economy (CRED, 2019; Elagib et al. 2019).
Earth Observation plays a key role for flood monitoring. This is inter alia the case, because available remote sensing imagery in combination with geospatial analysis can assist the national risk management during and after the analysis of flood events. During major disasters, support with Earth Observation information is provided by the International Charter Space and Major Disasters (hereafter the International Charter). The International Charter is a worldwide collaboration of space agencies and space system operators through which satellite data are made available as fast as possible for disaster management. It can be activated by registered users (typically disaster management authorities) to support disaster emergency response. Read more about Charter members and partners here.
On 13 August 2020, the International Charter was activated by the Ministry of Agriculture and Natural Resources of Sudan due to large floods partly caused by torrential rainfall in the Ethiopian Highlands. Out of Sudan´s 18 states, 17 experienced flooding according to the UN Office for Coordination of Humanitarian Affairs’ situation report by 14 September (UN OCHA, 2020a). Nominated by the German Aerospace Center (DLR), who is a member of the International Charter, the Ruhr-University Bochum (RUB) took over the project management of the activation in close collaboration with the Center for Remote Sensing of Land Surfaces (ZFL) of the University of Bonn and the Universidad Autónoma del Estado de México (UAEM) as value adders. Immediately after the activation, available imagery was processed to identify people and regions affected and, in continuous exchange with the ministry, supported national disaster risk management.
Together with North Darfur state, Khartoum state was among the states most affected by the floods. Khartoum state is vulnerable to floods due to its location in between two rivers, the Blue and the White Nile river. Urban agriculture has expanded in the city leading to an increase of water use as well (Schumacher et al. 2009).
Remote Sensing Based Flood Monitoring
Two different types of sensors can be used when working with remote sensing imagery: optical (passive) and radar (active) sensors. While optical sensors depend on sunlight and depict the reflection and absorption of sunlight via the spectral signature, radar sensors do not depend on sunlight. They send out a signal on their own and record the so-called backscatter. The backscatter signal can provide information on the surface structure and roughness. During heavy rainfall events, often linked to floods, high cloud coverage occurs which is a challenge for the use of optical remote sensing data. In these cases, the use of radar data is preferred, because radar signal penetrates clouds and can provide information regardless of the weather conditions.
In the case of the Sudanese flood event, as well as other natural disasters, a timely response is needed for stakeholders to assess the situation. Optical and radar data was used to identify flooded areas in Sudan.
Due to increased cloud-coverage during the flood-inducing weather conditions, cloud-filtering presented the first challenge when working with optical data. For some sensors, such as Sentinel-2 with 10 m resolution, the provided cloud-masks proved to be sufficiently accurate for many scenes. Very high resolution data, such as e.g. Pleiades imagery with 0.5 m resolution, require a different approach when aiming at satisfactory results. Especially during hazy conditions in some scenes, the included cloud-masks were not accurate enough for further processing.
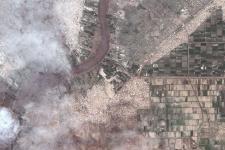
Two methods proved to be reliable and sufficiently fast in identifying clouds in the case of Sudan: First, a threshold approach in which a very high reflectance threshold was selected via testing and visual checking. Clouds result in very high reflectance across most optical bands. This method proved to be more successful with larger clouds within clear boundaries. In a second step, cloud shadows were masked via the geometry of the cloud-mask. The cloud-mask was duplicated and moved according to the angle of sunlight to cover the shadows. As a second option, clouds and shadows were traced manually. This proved to be a good solution in smaller scenes with few clouds or hazy conditions (Figure 1).

Figure 1: Complex cloud conditions which can only be used if masked by manual tracing. Pleiades Image provided by CNES via the International Charter, scene taken on August 15th, 2020. Source: Pleiades@CNES 2020.
After cloud-masking, surface-water areas were identified. Again, two different approaches can be applied: First, a threshold based on water-sensitive indices, such as the Normalized Difference Water Index (NDWI), was used (Gao, 1996). With very high resolution data, indices did not produce reliable results, especially in hazy conditions. Here, a supervised classification was conducted to discriminate water from “non-water” areas. The classification approach resulted in visually very accurate products when compared to true-color composites (Figure 2).

Additionally, two approaches which rely on radar data to identify water were used. By using radar data one does not need to mask clouds. If a scene (image material) taken before the flood event was at hand, a change-detection analysis was conducted. Otherwise, a threshold was applied onto the VH-backscatter. Steep terrain can cause false-positive when applying this filter. These false positives would need to be (manually) filtered in a post-processing step, which was not necessary for the areas of interest in Sudan.
Disaster Monitoring towards Disaster Management
According to the Humanitarian Aid Control (HAC) in Sudan almost 830,000 people have been affected until 24 September 2020. The most severely affected states were Khartoum, North Darfur, Blue Nile, West Darfur and Sennar (UN OCHA, 2020b)
High resolution monitoring helps to identify areas at risk with a high level of detail for small areas. At the same time, information on the people and cropland affected is important on a larger scale. Therefore, a geospatial analysis was conducted based on the identified floods areas (see also Figure 3).

Having identified the inundated areas, the affected population was extracted. Flooded areas were converted into a polygon. Rasterized population data, such as WorldPop (Tatem, 2017), was then masked using the flood-polygon. Finally, zonal statistics, specifically the sum of people affected per district, were calculated using shapefiles of the administrative boundaries and the raster layer of the affected population. The combination of remote sensing based flood detection with information on where people live and where land is usually cultivated helps to identify those areas affected by the disaster (Figure 4).

For disaster risk management geospatial information is relevant to identify affected areas and to further mobilize support.
While the floods decreased about three weeks after the first activation, the impacts of the floods are still severe. For example, polluted sanitation results in a decrease of available clean water. Health impacts are expected to occur. Pollution also affects farmers whose fields have been destroyed and no yield might be expected at the end of this season unless the ministry will support with supply of short mature varieties for the main crops such as Sorghum and Millet for replantation in the croplands. Especially small-scale farmers, who depend on agriculture are severely affected.
Remote Sensing and geospatial analysis cannot only support emergency response but also contributes to adapted risk management in terms of preparedness when a disaster occurs. It is wise to identify areas, which are prone to floods due to low elevation and their vicinity to river sides, already before a disaster takes place, to be able to act earlier when high rainfall rates are expected. These findings can also support further planning and prevent the settling of population close to flood risk zones as well as the protection of livestock and farming activities within areas that are vulnerable to experience flooding.
For the success of disaster monitoring and management a continuous exchange between risk management organizations on a governmental level and the scientific community is crucial. Furthermore, local understanding and spatial knowledge of the area affected is important to get guidance on where priority areas are located and on the interpretation of resulting maps to improve the final products.
All final products of the given Charter activation can be found here.
Acknowledgement
This article was contributed by Valerie Graw from the Ruhr-University Bochum, Germany, and Jonas Schreier and Adrian Strauch from the Centre for Remote Sensing of Land Surfaces of the University of Bonn (ZFL), Germany. The article was originally published on the UNOOSA Space4Water Portal.
Sources
CRED. Natural Disasters 2019. Brussels: CRED; 2020. This document is available at: https://emdat.be/ sites/default/files/adsr_2019.pdf
Elagib, N.A., Gayoum Saad, S.A., Basheer, M. et al. Exploring the urban water-energy-food nexus under environmental hazards within the Nile. Stoch Environ Res Risk Assess (2019). https://doi.org/10.1016/j.spc.2022.10.028
Gao, Bo Cai. 1996. “NDWI - A Normalized Difference Water Index for Remote Sensing of Vegetation Liquid Water from Space.” In Remote Sensing of Environment, edited by Michael R. Descour, Jonathan M. Mooney, David L. Perry, and Luanna R. Illing, 58:257–66. International Society for Optics and Photonics. https://doi.org/10.1016/S0034-4257(96)00067-3.
Schumacher J, Luedeling E, Gebauer J et al (2009) Spatial expansion and water requirements of urban agriculture in Khartoum, Sudan. Journal of Arid Environments 73:399–406. https://doi.org/10.1016/j.jaridenv.
Tatem, A. J. (2017). WorldPop, open data for spatial demography. Scientific data, 4(1), 1-4.
UN OCHA (2020a). Sudan. Floods Situation Report.14 September 2020. Available at: https://reliefweb.int/sites/reliefweb.int/files/resources/SUDAN%20Flood… (last access: 29.09.2020)
UN OCHA (2020b). Sudan Situation Report. Last Update 27.09.2020 Available via: https://reports.unocha.org/en/country/sudan (last access: 28.09.2020)