Since its creation, UN-SPIDER's data base on satellite data and products has gathered links and information to more than 250 data sources related to space-based disaster risk reduction and emergency response. These include many links to free satellite data as well as final analysis products such as hazard maps. Flood prediction, near real-time monitoring, risk assessments and damage assessments can all benefit from satellite data and are often also supported by in situ data and physical models. Yet, the diverse supporting data available matched with the various needs of authorities, first responders or researchers make it difficult to be aware of all the information available. To gain an overview we present several easily accessible and interactive web mapping tools that shed light on disaster management for floods from various perspectives. To find more data sources related to floods and other hazards, visit the data sources section of the Knowledge Portal.
1. The Global Flood Awareness System (GloFAS) - Flood prediction
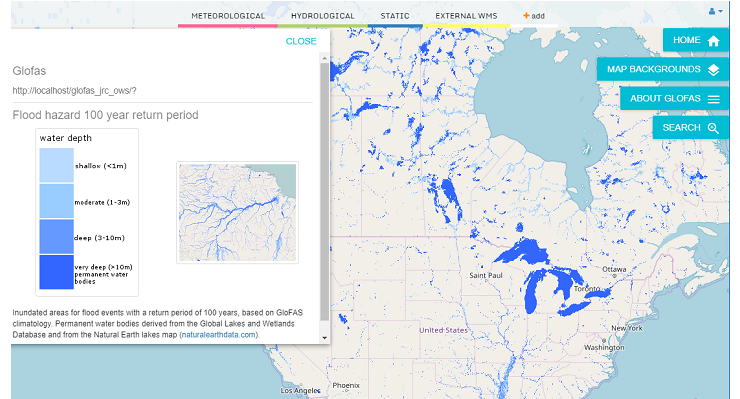
The Global Flood Awareness System (GloFAS) belongs to Copernicus' Emergency Management Service and was developed jointly by the European Commission and the European Centre for Medium-Range Weather Forecasts (ECMWF). Fully operational since April 2018, the web platform visualizes forecast products at 0.1° or ~11km resolution based on real-time weather forecasts and historical observations that enter a GIS-based spatially distributed hydrological model.
GloFAS's interactive map allows separate visualization of forecasted meteorological data, predicted hydrological data, such as stream flows categorized by their probability of occurring (hydrological return-period), static maps of lakes and reservoirs included in the model and reporting points where additional forecast information is available.
- Probabilistic flood prediction possible up to two weeks in advance
- Available WMS service for easy integration into personal GIS
- Data download can be requested (format: netCDF)
- Global spatial coverage at 0.1° or ~11km resolution (determined through European hydrological model + global land surface response model)
2. Dartmouth Flood Observatory (DFO) - Flood extent mapping
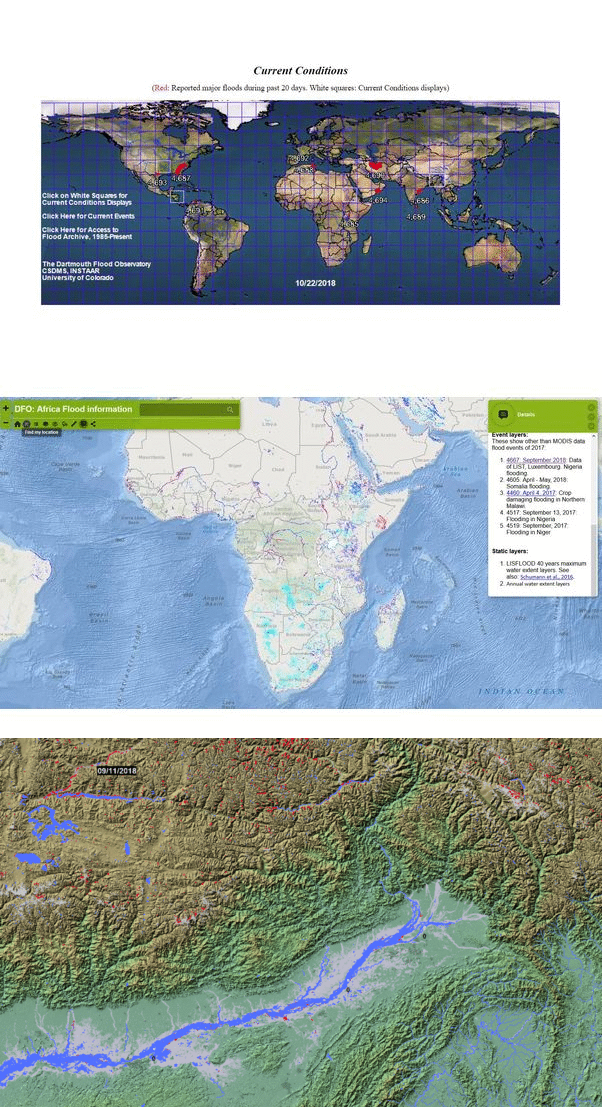
The Dartmouth Flood Observatory was founded in 1993 at Dartmouth College, Hanover, NH USA and moved to the University of Colorado, INSTAAR, CSDMS in 2010. It's funding is supported by NASA and the European Commission, through the Global Disaster Alert and Coordination System (GDACS) project, Joint Research Centre, Ispra, Italy. The observatory follows the mission of: conducting global remote sensing-based fresh water measurement and mapping in “near real time” as well as recording such information in a permanent archive. The Dartmouth Flood Observatory inundation maps are based on optical satellite imagery (MODIS Terra and Aqua). Individual map tiles that are updated daily are available to show currently-observed flooding (over the past 14 days to remove cloud obscuration). Where of use, Sentinel-1 radar images are also utilized.
DFO's flooded area maps illustrate in light gray: the satellite record of flooding, 1999-2016; in red: currently-observed flooding (past 14 days) and in blue: bankfull reference water.
Additional maps and statistics are available such as: 1. River and Reservoir Watch (daily updated statistics and maps of satellite-based river discharge and reservoir area measurements) 2. Flood generating watersheds and drought-affected watersheds 3. 7-day accumulated rainfall (NOAA) 4. SSMI/SSMIS/AMSR2 Total Precipitable Water
- Mapping of active floods and comparison with historic flood record (flood hazard)
- Web Portal DFO Viewer and WMS service available with inquiry
- Geotiffs of DFO flood products and vector data of the historic flood record available for locations mapped starting in 2018 on the respective area's current event site.
- Global spatial coverage of 250m resolution for MODIS products, event-based use of Sentinel-1 products with 10m resolution, reference surface water data set (February 2000) at 90m resolution
- Methods are further described at DFO Flood Event 4516
3. Near real time Global Flood Mapping - Flood extent mapping
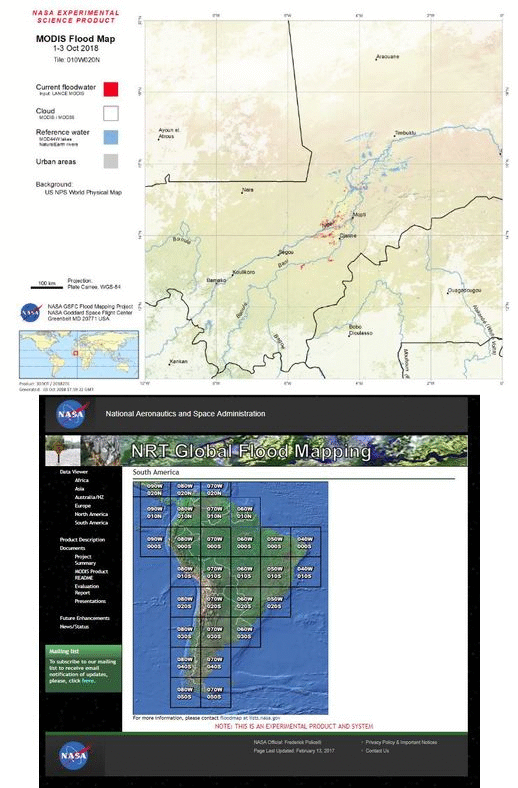
Similar to the DFO maps, NASA's near real-time Global Flood Map product is based on optical satellite imagery (MODIS Terra and Aqua). In fact NRT Global Flood Mapping builds on the DFO's efforts in order to map floodwater extent in detail for active floods. NASA's website provides links and information about the automated daily flood and surface water products produced at NASA Goddard.
- Near-real time (past day 3 day, 3 day, 1 day, 14 day composite)
- Easily accessible download of daily updated vector and raster files of MODIS Flood Water, MODIS Surface Water, MODIS Water Product, MODIS Flood Map (.shp, .kmz, .tif, .png)
- Global spatial coverage of 250m resolution
4. Flood and Drought Portal - Flood prediction
Developed by the UNEP in Partnership with the International Water Association and the DHI Water & Environment and 10 water authorities across six countries, the Flood and Drought Portal provides near real-time access to hydrographic, meteorological and demographic information.
- Scenario data
- Pilot region: Volta River Basin
5. Database for Hydrological Time Series of Inland Waters (DAHITI) - Reservoir heights
The Database for Hydrological Time Series of Inland Waters analyzes satellite data from Envisat, Jason-2 and Sentinel 3 to create time series of water levels in inland waters. Provided by the TU Munich, an interactive web map displays target water bodies that are or were covered by the orbit of the satellites above. Most time-series start at 2008 with some continuing through until 2018. The recent change to Sentinel-3 means that not all locations are available yet, but the researchers are open to requests if a satellite is available today for certain target. The methodology is described in more detail here.
- ~ 10 year water level statistics for significant inland waters world-wide
- Surface area and volume of water bodies available in some cases
- Data access possible through DAHITI-API
6. G-REALM - Global Reservoir and Lake Elevation Database - Reservoir heights
Another web map presenting data on reservoir heights is the Global Reservoir and Lake Elevation Database (G-REALM). Updated products are delivered within 7-10 days after satellite overpass. In contrast to DAHITI, graphs presented on G-REALM do not give absolute height but illustrate height variations.
- Accuracy for largest lakes such as Great Lakes, USA, Lakes Victoria and Tanganyika in Africa better than 10cm rms
- Accuracy for smaller lakes or those that experience more sheltered (from wind) conditions can expect to have accuracy's better than 20cm rms (e.g. Lake Chad, Africa)
7. EFAS European Flood Awareness System - Flood prediction
Accessible only to partners of EFAS: The European Floods Awareness System (EFAS) is providing flood forecasts to national and/or regional authorities responsible for flood forecasting. EFAS is the forerunner of GloFAS but also running parallelel. EFAS only makes data available to national, regional or local authorities that are legally obliged to provide flood forecasting services or have a national role in flood risk management within their country. EFAS forecasts are provided for free and are not limited to EU Member States only.Partners
EFAS compares river flow forecasts produced using various methods. Deterministic rainfall forecasts from the DWD (Deutscher Wetterdienst, the German national meteorological service) and the European Centre for Medium Range Weather Forecasts (ECMWF) are used.
EFAS map visualizes flows at points of interest in excess alert levels. With the EFAS Severe Alert Level (SAL) corresponding to a simulated flood event with a return period of >20 years are indicated in purple, flows in excess of the EFAS High Alert Level (HAL) in red and flows in excess of the Medium Alert Level in yellow. Thereafter, numbers in the subsequent rows indicate the number of EFAS ensemble members produced using the ECMWF ensemble (EUE) and the COSMO-LEPS limited area ensemble (COS) that exceed the HAL and Severe Alert Levels (SAL).
- Layers include: Flood summary, hydrological-, meteorological (precipitation)-, initial condition (soil moisture, temperature and snow water), back ground layers (landslide risk, flood protection levels) and flash flood layers
- Archive data 2014 freely available
- 6.5 to 18 km resolution
8. Famine Early Warning Systems Network (FEWS NET) - Precipitation monitoring
The Famine Early Warning Systems Network (FEWS NET), supported by the USGS and USAID data portal provides meteorological data and remote sensing products related to flood, drought and crop needs. Backward looking aggregation and comparisons with the historic record of 10-day rainfall to illustrate excess and 7-day global forecast system precipitation data are provided on a daily basis by the NOAA Climate Prediction Center.
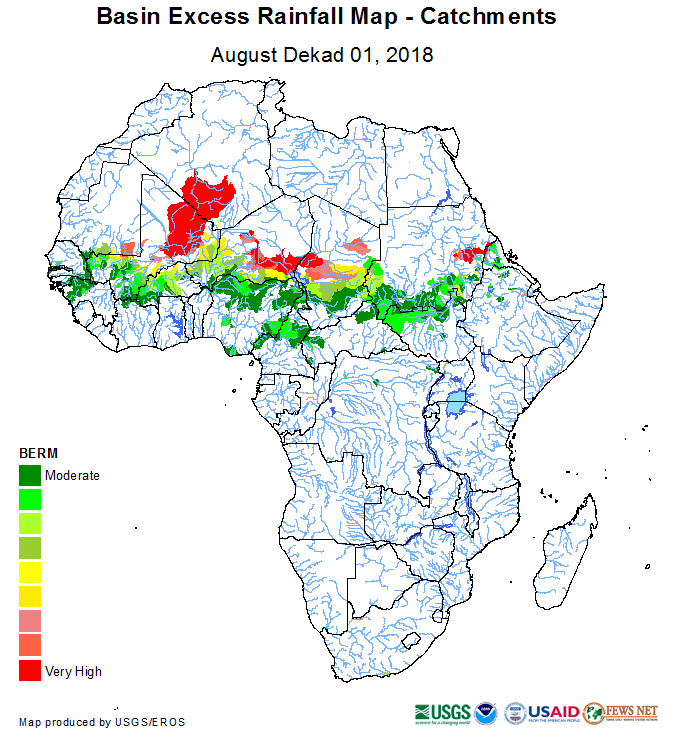
- Basin Excess Rainfall Map, Seasonal Rainfall Accumulation, Standardized Precipitation Index, Croplands Water Requirement, Soil Moisture, Rainfall Anomaly, Seasonal Evapotranspiration
- 0.1 to 0.25 degree lat/long resolution or ~11km^2, ~27km^2
- Africa , Central America, Caribbean & Mexico, Central Asia, Middle East, South Asia
9. EOSDIS WorldView - Flood risk map
NASA's Worldview interactive web map that facilitates adding multiple layers and downloading layers of interest.
- Rain rate over oceans, precipitation estimate (Aqua or AIRS), flood hazard, dams (SEDAC), reservoirs, snow cover, soil moisture, snow water equivalent, water vapor, urban rural extents below 10m elevation
- Varying spatial resolution depending on product eg: MODIS (250m), SSMIS (28km), Landsat 7 (30-120m)
- Easy downloading of data
- Allows viewing of time series analysis
10. Global Disaster Alert coordination System (GDACS) - Flood and hurricane location mapping
The Global Disaster Alert and Coordination System (GDACS) is a cooperation framework between the United Nations, the European Commission and disaster managers worldwide. Its mission is to improve alerts, information exchange and coordination the first phase after major sudden-onset disasters. The map illustrates disaster alerts in the past 4 days.
The web map allows tracking of hurricanes and connects to other resources such as UNOSAT or JRC maps. Automatic estimates and risk analysis are provided by the European commission Joint Research Centre.
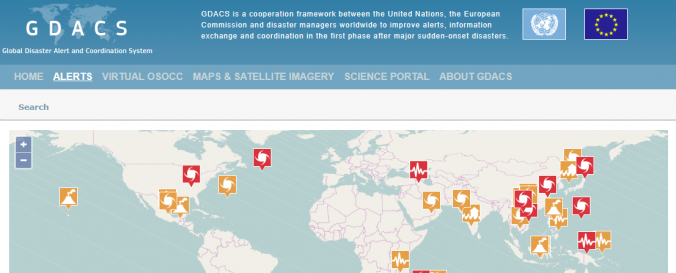
- Near-real time alert
- Estimates of exposed population
- Data sharing from multiple sources through the website and response coordination
- Spatial resolution: varying by hazard, product and satellite used
11. Hazards Data Distribution System Explorer (HDDS) - Flood extent mapping
The Hazards Data Distribution System Explorer (HDDS) records known disaster events. After a known flood event, the site lists satellites images that are available for the area of interest. Various satellites will be proposed, including those with associated costs (e.g WorldView 2). These "restricted datasets are available for official response purposes only, and require approved access." However, if final shapefile products after processing from WorldView are available these can be accessed for free.
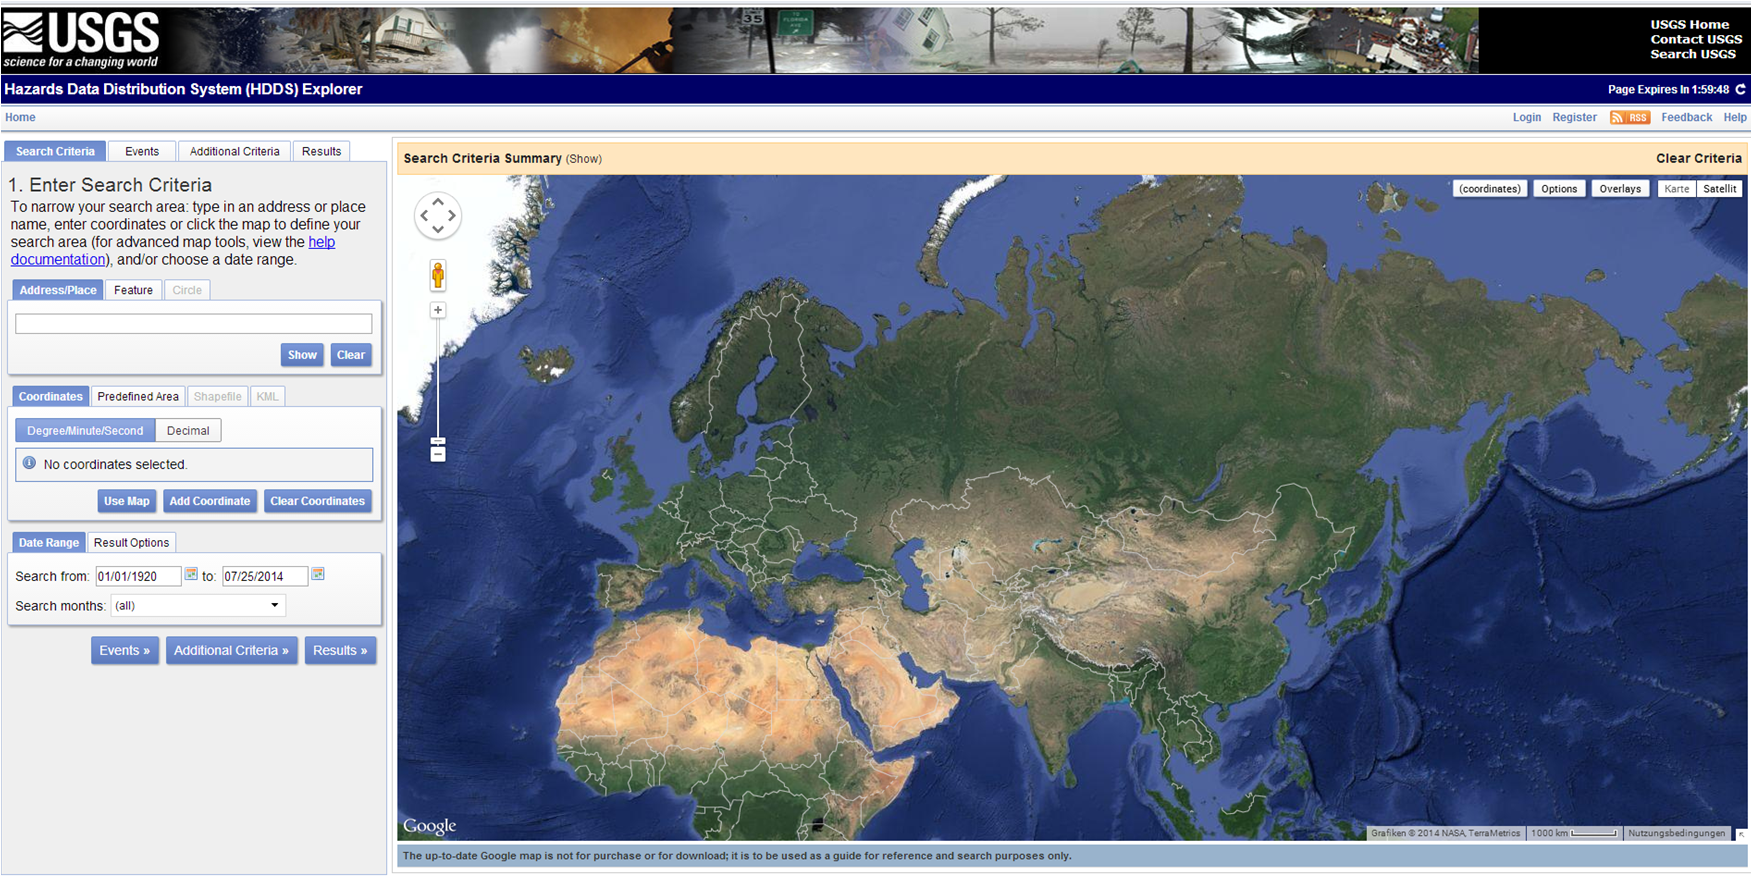
- Access to raw data and flood extent maps (various formats and resolutions) of know events
- Archive flood data
12. ITHACA Standard Precipitation index/ Extreme Rainfall detection system - Precipitation mapping
The ITHACA drought platform mainly targets drought. As flood and drought are both precipitation dependent, the website also holds useful information for flood monitoring as the web map provides a thematic map of the 3-month Standard Precipitation Index (SPI). The global precipitation time-series (0.25° spatial resolution) is derived from the Tropical Rainfall Measuring Mission (TRMM) Multisatellite Precipitation Analysis estimation, computed at daily intervals (TRMM 3B42 daily data).
The ITHACA Extreme Rainfall Detection System is a service for the monitoring and forecasting of exceptional rainfall events. Five different alert levels can be downloaded, based on specific rainfall thresholds, defined as the amount of precipitation for a given duration (12 hr, 24 hr, 48 hr, 72 hr, 96 hr). Threshold values were calculated, for every aggregation interval, on the basis of a percentage of the mean annual precipitation.
- Visualization of Precipitation Anomalies at ~27 km resolution (no download possible)
- Downloads of tiff files for rainfall alert levels at ERDS with ~11km resolution
- Spatial coverage: Africa
13. Global Risk Data Platform (UNISDR) - Exposure and damage assessments
The Risk Data Platform by the United Nations Offices for Disaster Risk Reduction (UNISDR) includes an interactive web map that allows to view flood hazards and estimates of losses related to floods as well as the exposed population.
- View, measure, download .kml for Flood hazard data (return periods 25-1000 years)
- Layer of exposed population
- Data sharing from multiple sources through the website and response coordination
The main purpose of all GAR Atlas datasets is to broadly identify high risk areas at global level and also identifying areas where more detailed data should be collected and where detailed risk assessments are to be performed.
14. Aqueduct Global Flood Analyzer - Flood prediction with pure hydrological, climate models excluding satellite information
The Aqueduct Global Flood Analyzer is a web-based interactive platform which measures river flood impacts by urban damage, affected GDP, and affected population at the country, state, and river basin scale across the globe, as well as 120 cities. It makes use of a series of models, but no remote sensing activities. Models that are included are hydrological models, global climate models, inundation models and socio-economic models and impact models. Detailed knowledge of the models' assumption is needed to understand where it can be rightfully be applied in decision making, some limitation are listed here.
15. Desinventar - Inventory of losses related to disasters
UNISDR's DesInventar, which is part of the Sendai Framework for disaster risk reduction is a joint database recording the number of deaths, damage, economic loss after disasters. The website allows searching of past flood events and visualizing indicators at district level.
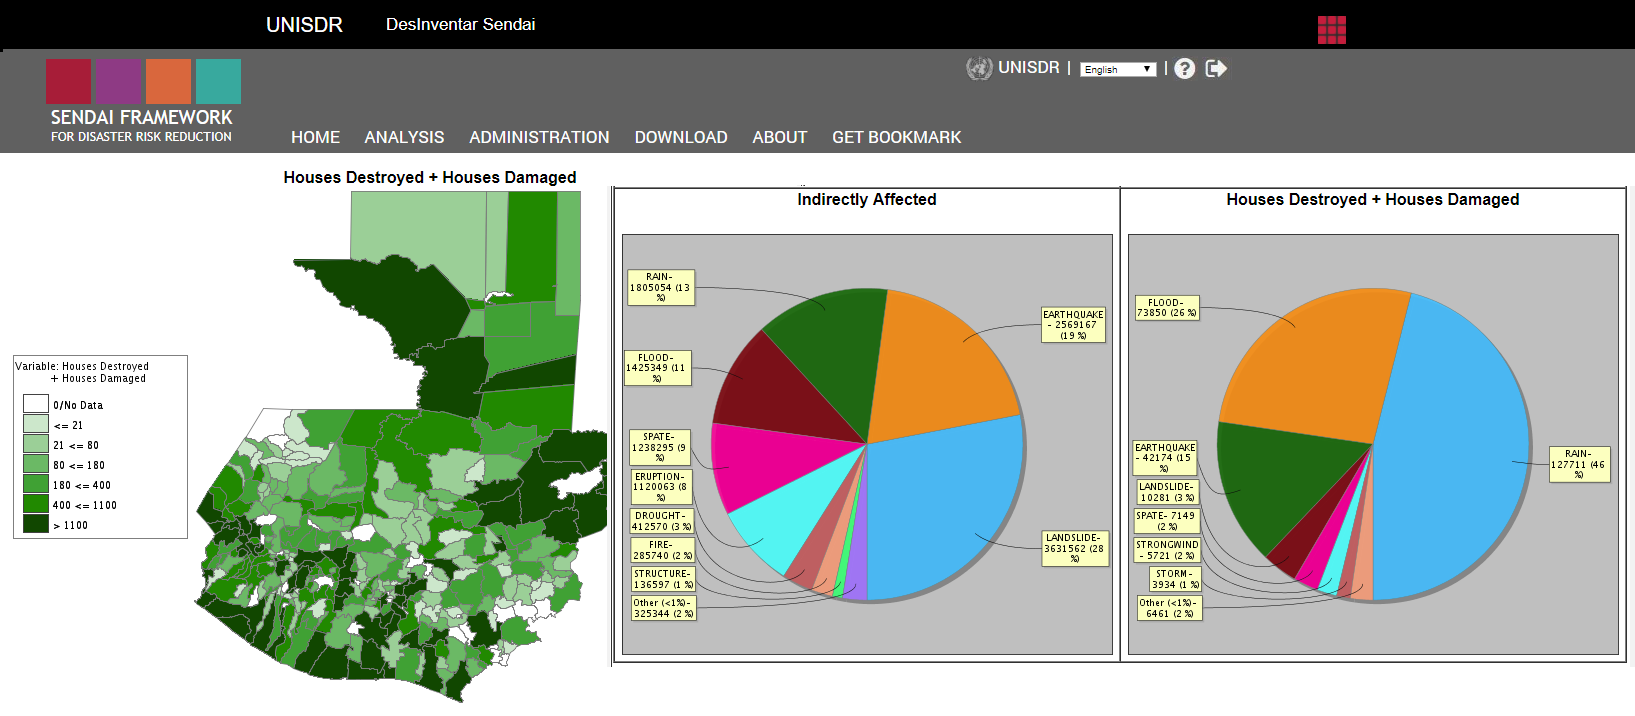
- View number of deaths, damage, economic loss after disasters at district level
16. PDC DisasterAWARE and DisasterAlert App - Flood and hurricane location mapping, precipitation forecasts
DisasterAWARE is an integrated platform, by Pacific Disaster Center, providing situational awareness, decision support, and information exchange capabilities for disaster management. Alerts for its active hazard information are based on information by credible warning agencies (according to the PDC's standards).
- All-hazards warning, analysis, and risk evaluation
- Visualization, that allows measuring, drawing polygons, placing target markers or annotating
- Storm pathways, wind speeds, rainfall accumulation (TRMM Mission), Dartmouth flood magnitude method applied, global clouds layer (~27km resolution), surface air temperature, sea surface temperature (50km resolution)
- Historical hazards within regions of interest
- Regional overview of population and population density
- Governments, NGO or International organizations can create account for more access
17. FAO Earth Observation - Precipitation and vegetation monitoring
The earth observation products provided by the Food and Agriculture Organization of the United Nations are focused on agricultural indexes. The relationship of crop stress, precipitation indexes and mean vegetation indexes and information on the crop growing season also provide value for flood monitoring.
- Decadal maps on country level of indexes such as: agricultural stress, estimated precipitation and precipitation anomalys,
based on METOP-AVHRR
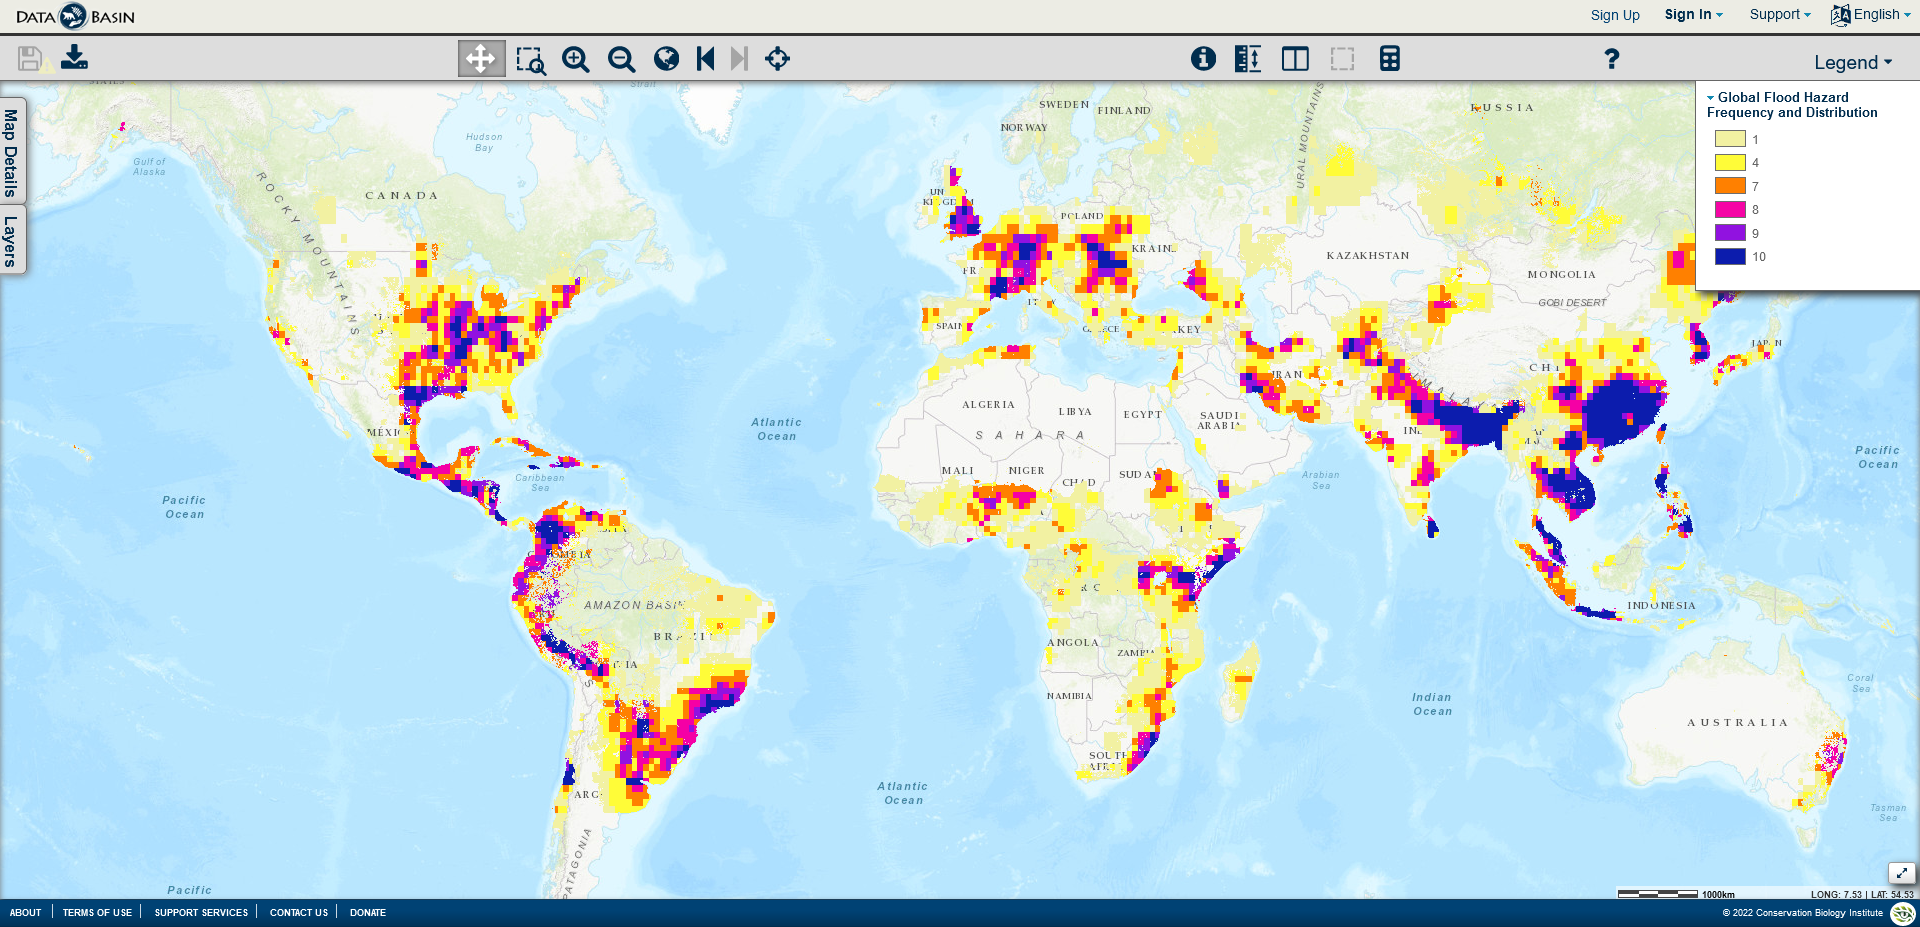
18. Data basin 1985 to 2003 Archive data- Flood risk map
Provided by the Center for Hazards and Risk Research (CHRR); Center for International Earth Science Information Network (CIESIN), Columbia University; International Bank for Reconstruction and Development and the World Bank this data set holds information on global flood hazard and risk distributions from 1985-2003. This archive presents raster data layer on 2.5 by 2.5 minute grid, combining the flood hazard frequency distribution with global flood mortality risks and global flood proportional economic loss.
19. Flood Tools Map my Risk - Flood risk map
Flood Tools Map my Risk is a tool for personal application for residents of the US. Offered by the private insurance company National Flood Services LLC, it presents a categorized map of flood risk for the continental United States.
- Spatial Coverage: US
- Composite data of Flood plains, historical floods, infrastructural hazards (Dams, Levees), Hurricane Path
- Non disclosed data source, spatial resolution or method
20. Mi-SAFE Viewer - Shore risk assessment
The MI-SAFE software and web viewer were developed under the EU funded FP7 project FAST (Foreshore Assessment using Space Technology). The MI-SAFE viewer is meant to illustrate how coastal vegetation can attenuate storm surge wave height for coastal locations anywhere in the world. Vegetation types are based on 2009 Corine Land Cover data, for non temperate zones on a global level, a global distribution of mangroves map from 2011 is applied to indicate whether the encountered vegetation are mangroves.
- Global coverage of bathymetry and topography (SRTM15_plus dataset) is created by the Scripps Institution of Oceanography
- Sentinel 1,2 and Landsat 5,7,8 based inter-tidal elevation
- Information gives confidence in level of estimates
- Proposes crest height for wave attenuation
- XBeach software
21. NOAA LEO/GEO Flood Mapping Product - Flood extent mapping
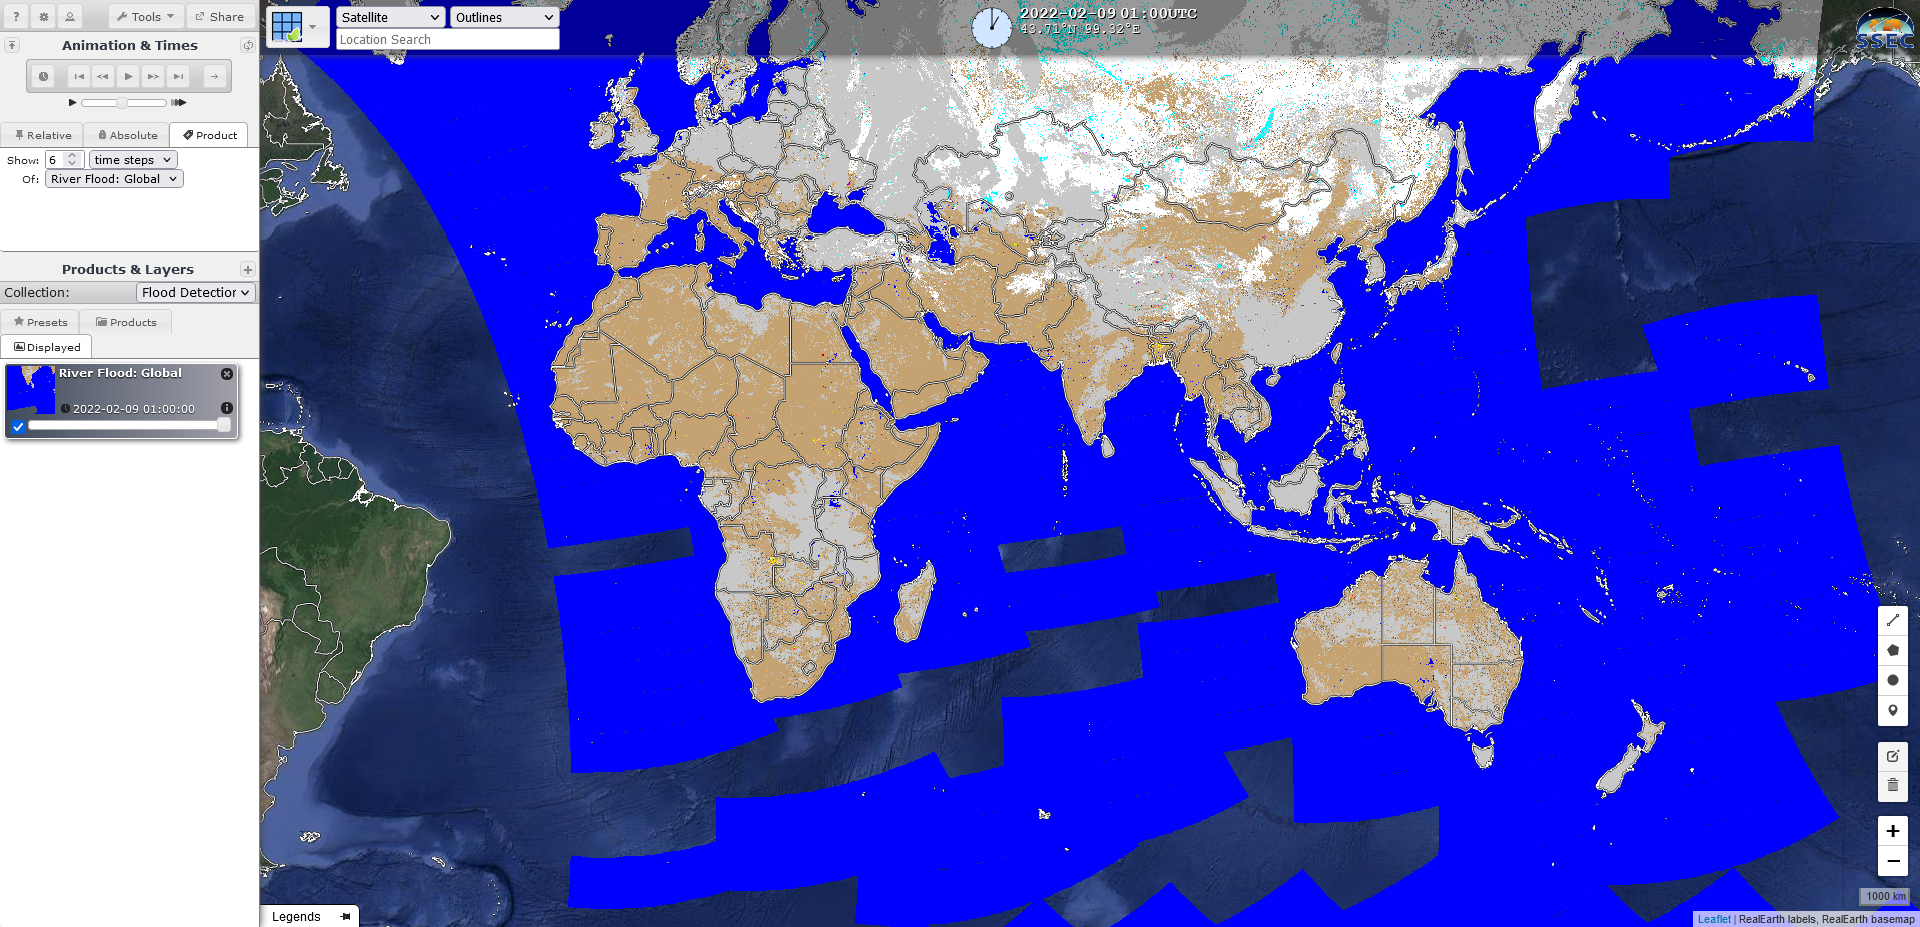
The Geostationary and JPSS Flood map product is developed by George Mason University and the products are processed in near realtime at the Cooperative Institute for Meteorological Satellite Studies. Funding for this project is provided by NOAA/NESDIS, JPSS Program Office and GOES-R.
The flood products are created from different environmental and meteorological satellite systems and their data: SUOMI-NPP (VIIRS), NOAA-20 (VIIRS), Himawari-8&9 (AHI), GOES-16&17 (ABI). The VIIRS, ABI and AHI flood products provide flood areal extent and can be used for situational awareness.
More information on the different products, their resolutions and other capabilities, can be found in the NOAA Global Flood Product Quick Guide.
Different presets for visualization in the RealEarth WebMap application can be accessed here.
- Spatial Coverage: Global
- Spatial Resolution: depending on product, between 375m and 1km
- Daytime-only flood extent
- Archive data available
- Download data in GeoTiff, HDF4, PNG, and SHP format (via FTP)
More useful resources are continuously updated on the Links and Resources Page and can be followed on by joining the UN-SPIDER mailing list.
Finally, if you liked this comparison, but would like even more detail ARSET presents the differences of some of the available flood web maps named above here.
