Case Study Background
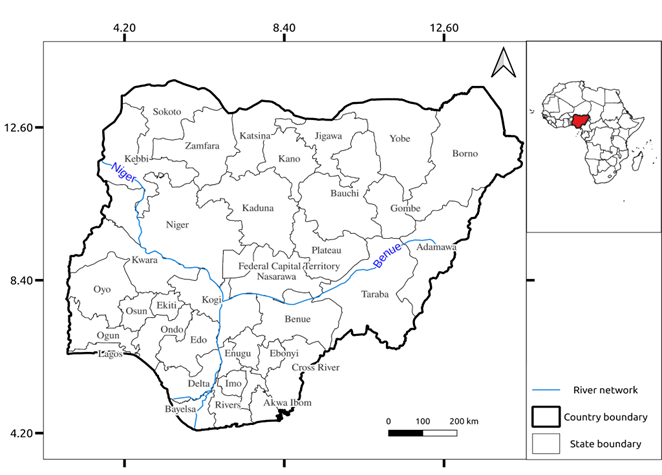
Severe, riverine flooding is a recurring natural disaster that affects many parts of Nigeria during the long rainy season, typically from April to October. Due to its geographical location, the country is susceptible to the flow of two major rivers, the Niger and Benue, which often overflow their banks and cause flooding in the surrounding areas. The flood situation in Nigeria is particularly challenging as it is caused not only by adverse rainfall conditions but also by dam openings in neighboring countries.
In September 2022, the country experienced one of the worst flooding incidents in a decade. The harsh rainy season (Figure 1) resulted in severe floods and significant loss of life and property. According to OCHA reports, by the end November, over 600 fatalities and over 1.4 million people affected in total have been reported throughout the country. 34 out of the 36 states (Figure 2) were affected [2].
GloFAS Application
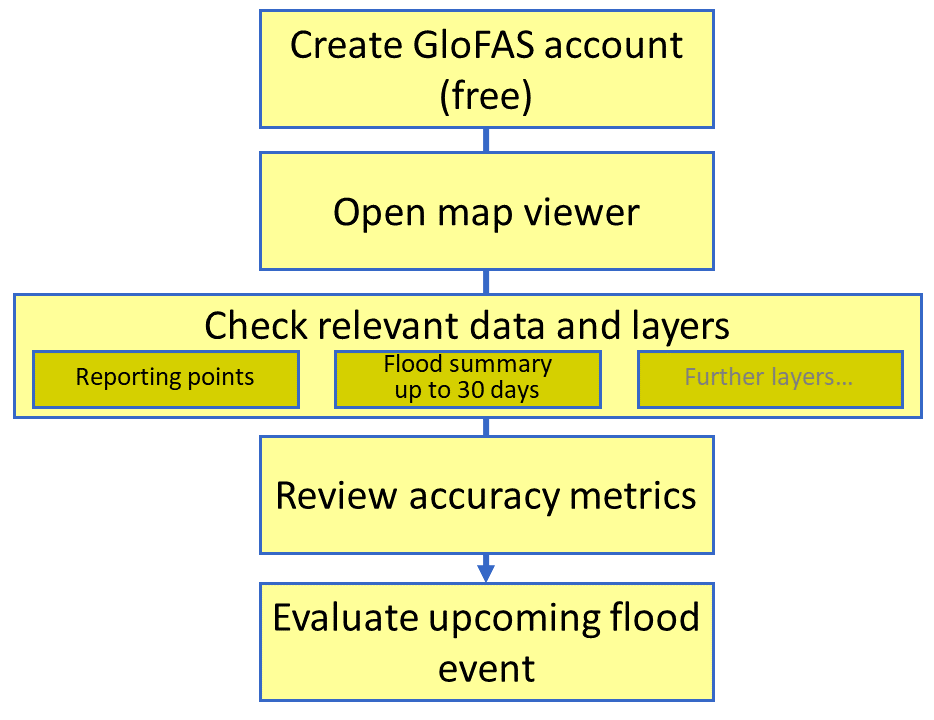
1. Map Viewer
The GloFAS system can be utilized via an interactive map viewer, which displays temporal datasets in various categories (Figure 3) such as initial conditions, hydro- and meteorological conditions, flood risk layers, evaluation and static layers, as well as monitoring layers. These different layers of information complement each other to provide valuable insights regarding a flood situation.

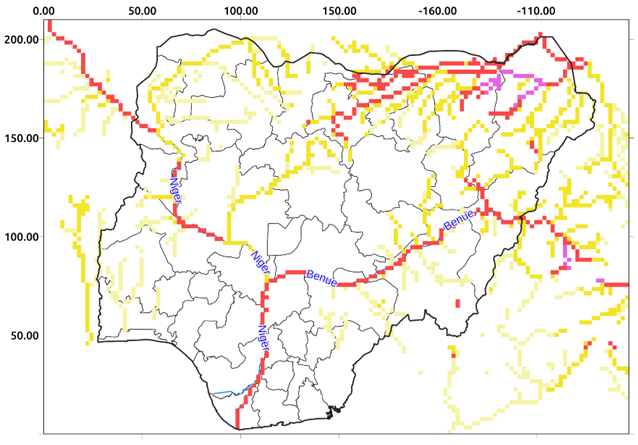
2. Flood Summary
In the context of flood early warning products, GloFAS flood forecast information can be found under the hydrological layer category. The flood summary layers combine the exceedance probabilities of three different returning periods of 2, 5 and 20 years into categorical information, distinguished by different colors. Further, different color intensities represent the actual exceedance probabilities. Figure 4 shows the flood summary for the Benue and Niger rivers as shown by GloFAS on 2022-09-15. Based on the color, it can be inferred that a flood of a magnitude that statistically occurs once every 5-20 years can be expected (with a probability above 75%). For more detailed flood forecast information, GloFAS provides flood summaries with a lead time of 4-10 days and 1-3 days. Detailed information on the interpretation of the flood summary layer can be accessed here.
Many layers, such as the flood summary, can also be displayed within GIS software via WMS-T (Web Map Service Time) integration. This way, GloFAS data can be visually overlaid with existing datasets, for example by disaster management agencies. A brief guide can be found in the GloFAS wiki.
3. Reporting Points
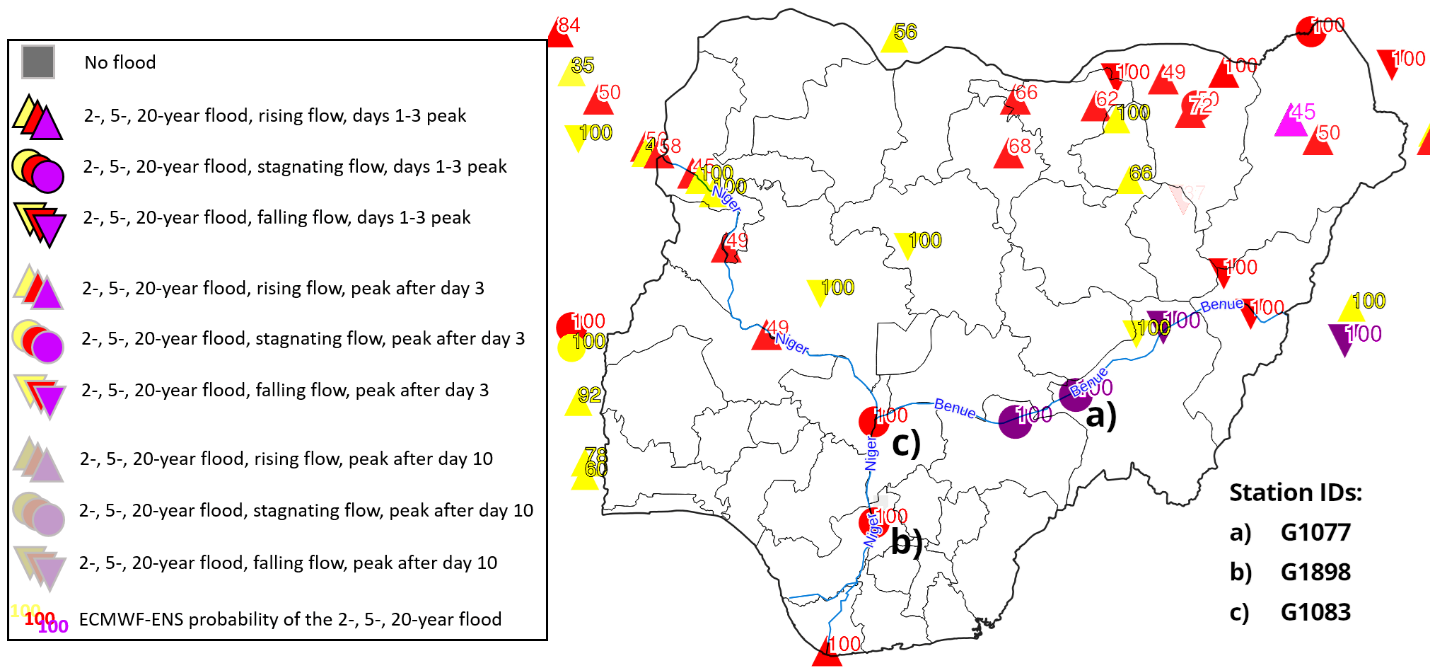
The reporting points layer provides data that can be used for flood early warning. It includes many fixed stations all over the globe that are situated along rivers, and as a result, information on the river discharge at these sites is provided. From the reporting points along Niger and Benue rivers on 2022-09-15 shown in Figure 5, information about the rivers’ discharge can be deduced and subsequently inform about the flood situation.
The shapes of the reporting points indicate different temporal phases in relation to the flood peak (Figure 5). The circular reporting points on the lower Benue river and at the confluence of the Niger and Benue, for example, imply that the discharge was at its peak at the currently selected date and was not expected to significantly increase in the following days. The colors and their intensities represent the different return periods and the exceedance probabilities respectively; the purple color shows that the discharge had a return period exceeding the 20 years threshold, while red implies a 5-20 years return period and the yellow color implies a 2-5 year return period. In addition, the numeric percentage probabilities for the respective category are indicated on each reporting point. For this particular case, there was reason for alarm since the magnitude of the discharge was expected to exceed that observed or likely to be observed in 20 years time, especially along the Benue river; meaning a large flood with potentially devastating impacts.
4. Reporting Points: Hydrographs
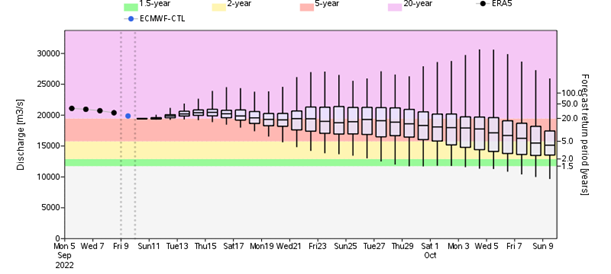
In addition, each reporting point carries a wide range of hydrological information displayed as an on click pop up window in the map viewer. This information includes attribute information about the station, such as geographical location, forecast summary, consistency diagrams as well as a discharge hydrograph showing the probabilistic forecast for the next 30 days based on ECMWF-ENS calendar matrices showing the evolution of forecasts in relation to the exceedance of critical hydrological thresholds (Figure 6, Figure 7).
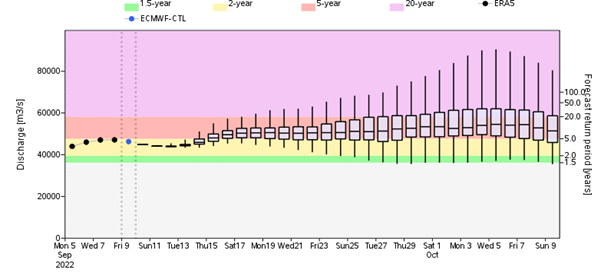
The discharge hydrograph for 2022-09-10 for station ID G107, located along the Benue river (see Figure 5), is displayed in Figure 6. The hydrograph showed a projected peak on the fifth forecast day (2022-09-15). The maximum discharge level was estimated to be within the purple zone, implying that the return period of the expected discharge would be beyond 20 years. The trend of the hydrograph signified a decreasing discharge trend, thus a decrease of the floods. Further downstream at station G1898 located along the Niger river around the Anambra area (see Figure 5), a larger discharge volume compared to station G1077 could be observed. This can be explained by the confluence of the Niger and Benue rivers. The hydrograph at this station showed an upward trend with a peak forecast foreseen to happen around 20 days after the forecast date and the maximum discharge would have a 5-year return period (Figure 7).
5. Reporting Points: Flood Consistency Diagrams
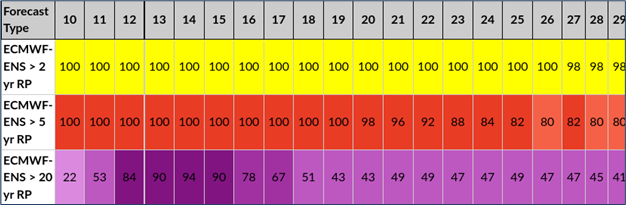
The flood consistency diagrams representing the probabilities of exceeding each of the three return period thresholds are also displayed as a pop-up window for each reporting point. Figure 8 shows the consistency diagram for station G1077 on 2022-09-10. For the first 10 forecast days, the probability of the discharge surpassing the 2- and 5-year thresholds was saturated (100% ensemble probability). These percentages are based on the number of forecast model members which exceed the threshold. For example, if 25 out of the 51 ensemble members predict a flood over 20 year return-period, the percentage value shown in the table would be about 49%. Therefore, in this example, the expected return period shown on the reporting point is that of 20 years with the peak being on the 4th day after the forecast date (2022-09-14) at 94% exceedance probability (48 out of 51 forecast members).
6. Flood Extent Estimation
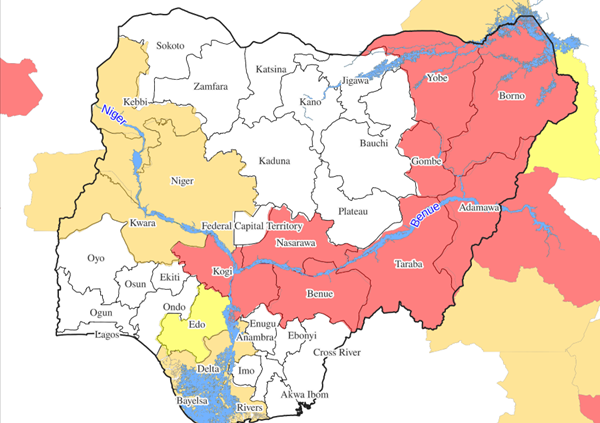
GloFAS also provides an estimated flood extent at 1km resolution based on the matching of return periods from the GloFAS streamflow forecast and a catalog of modeled inundation extents. Figure 9 shows the expected inundation extents at Benue and Niger rivers as output by GloFAS on 2022-09-10. Based on the intersection between various spatial datasets such as population, critical infrastructure, land use and the 1km inundation extents, an impact index aggregated over level 1 administrative boundaries (in the case of Nigeria: States) is generated and represented in form of a categorized choropleth map. Figure 9 shows the potential impact of the floods aggregated over the various states of Nigeria from 2022-09-10 based on GloFAS’s impact matrix color-coding (see Figure 10). It can be inferred that the most impacted states would be those along the Benue river including Kogi, Benue and Nasarawa among others, which could face additional river discharge brought about by the opening of the Lagdo dam in the neighboring Cameroon which is not taken into account by GloFAS.
7. Rapid Impact Assessment
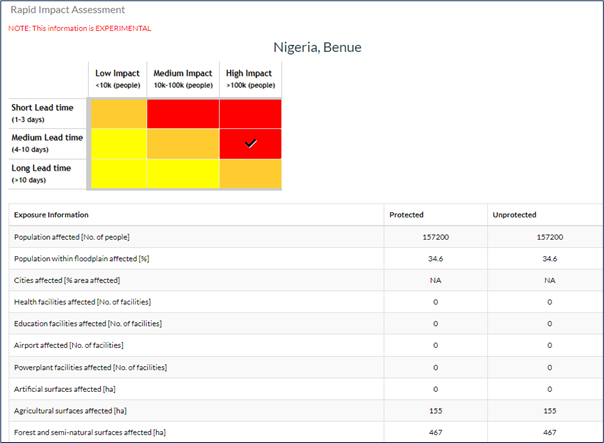
Further information on the impact details is available as an on-click pop-up window on each of the administrative units. An impact matrix indicating the lead time and the number of affected people is used to grade the level of impact. Figure 10 shows the anticipated impact at Benue state, which was expected to be high (red zone) with more than 100.000 people affected. Further, a detailed breakdown of anticipated exposure information and flood event information is provided as a table of absolute numbers.
8. Accuracy and Reliability Evaluation
GloFAS products are derived from deterministic and probabilistic models. Therefore, accuracy is highly dependent on the system calibration. In this regard, for every GloFAS forecast product, an evaluation report on accuracy and reliability based on actual river gauge measurements is generated. GloFAS uses the modified Kling Gupta Efficiency (KGE) and its three components (Pearson correlation, bias and variability ratios) to report on temporal errors, bias ratio errors and variability simulation errors between the simulated and observed river discharges.
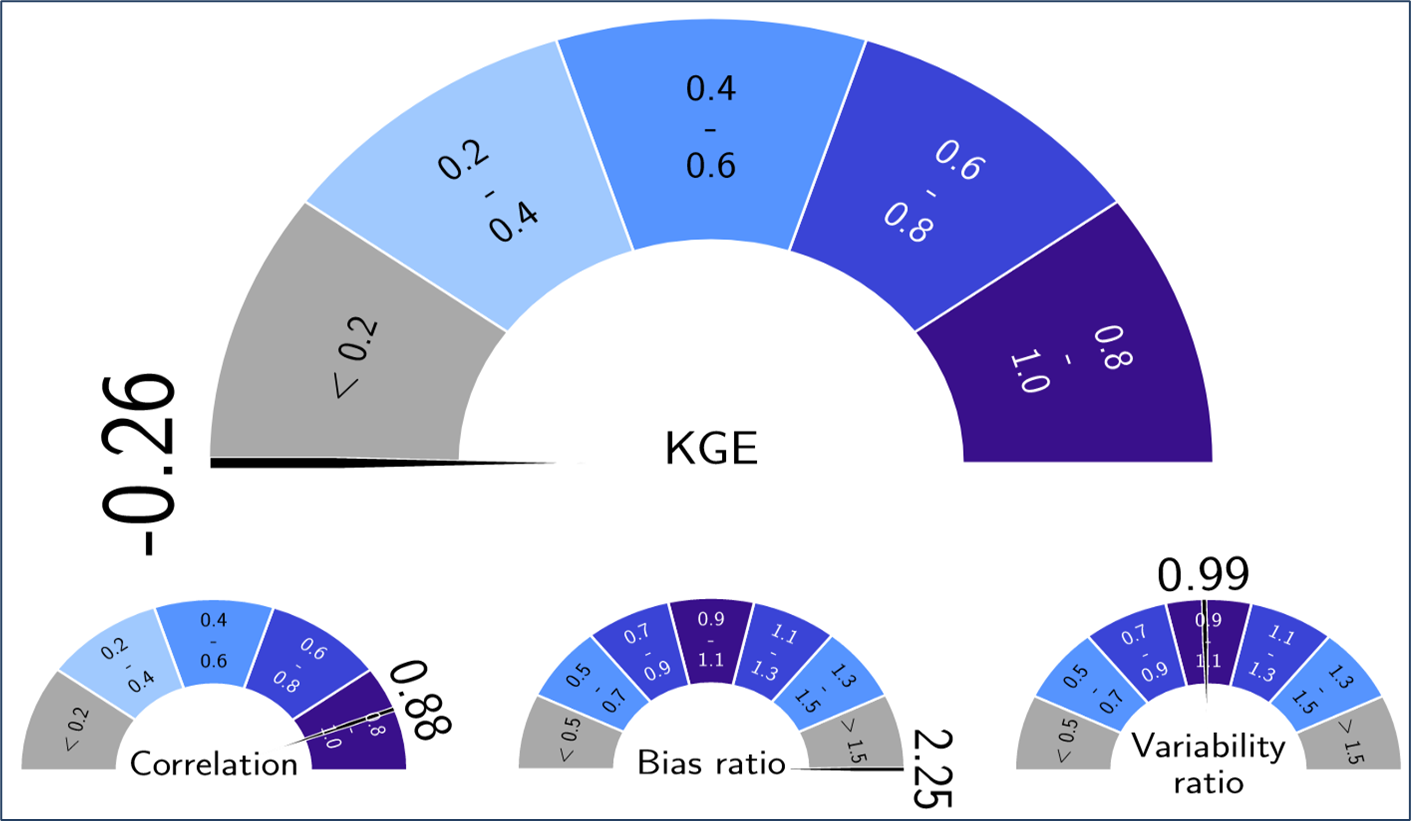
Figure 11 shows the KGE for station G1083, which is uncalibrated, with an overall KGE score of -0.26, a Pearson correlation of 0.88 and a bias ratio of 2.25. As a visual confirmation of the KGE and its components, climatological discharge statistics for both observed and simulated discharges are calculated for each month and displayed over a 14-month period. The correlation is high if simulation and observation co-vary, the correspondence between the medians and the outliers reflect the bias and variability ratio respectively.
In this example case of the 2022 Niger/Benue flood, GloFAS accurately predicted a major flood of the Benue and Niger river many days in advance. During the flood event, the Nigerian National Emergency Management Agency (NEMA) activated the International Charter Space and Major Disasters in a timely manner, where the National Space Research and Development Agency (NASRDA) acted as Project Manager for the Charter Activation. The flood maps, consequently created on the base of near real-time satellite imagery, made the significant flood extent clear.
Coincidentally, a joint event was held by UN-SPIDER, ZFL Bonn and NASRDA in Nigeria together with other Nigerian agencies just a few days before the flood event took place. In part thanks to the workshop with a focus on GloFAS and a simulated flood event of the Niger river, there was timely awareness of the scale of the upcoming flood event by the stakeholders.
Cases like this show that GloFAS can be a valuable tool in flood early warning, especially in Africa and other regions where national or local early warning systems are not available everywhere. As such, GloFAS could become an important pillar in the context of the “Early Warnings For All” initiative recently launched by WMO and UNDRR, which aims to “to cover everyone everywhere by 2027” [3]. However, some limitations of GloFAS need to be kept in mind.
Conclusion
In conclusion, the Global Flood Awareness System (GloFAS) has emerged as a valuable tool in the flood management cycle, particularly in flood forecasting, warning, and response planning. By leveraging hydrological models, satellite data, and ECMWF meteorological data, GloFAS can provide early warning of potential riverine floods up to 16 days in advance. This information can help emergency managers and decision-makers to better plan for and respond to flood disasters, including evacuating vulnerable population, positioning resources, and coordinating response efforts. While there are still challenges in integrating and interpreting GloFAS outputs, its application in the flood management cycle has already demonstrated significant benefits and potential for further development. Ultimately, the continued improvement and expansion of GloFAS can contribute to building more resilient and adaptive communities, capable of responding to increasingly frequent and severe flood events.