![]()
United
Nations
Extreme Temperature

Definition
Facts and figures
Further information
UN-SPIDER Regional Support Offices with hazard-specific expertise
Related content on the Knowledge Portal
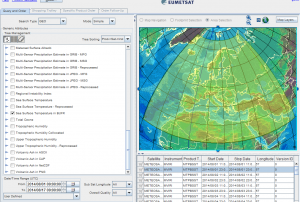 Meteosat 10 (SEVIRI-MSG), Meteosat 9 (SEVIRI-MSG), Meteosat 8 (SEVIRI-MSG), Meteosat 7 (MVIRI-MTP), Meteosat 6 (MVIRI-MTP), Meteosat 5 (MVIRI-MTP), Meteosat 4 (MVIRI-MTP), Meteosat 3 (MVIRI-MTP), Meteosat 2 (MVIRI-MTP), Metop (IASI), Metop (GOME-2), Metop (ASCAT), Metop (AMSU-A), Metop (MHS), Metop (AVHRR), Metop (GRAS), Metop (HIRS), Metop (A-DCS), Metop (SARSAT), Metop (SEM)Publishing institution:

The Space and Upper Atmosphere Research Commission (SUPARCO) of Pakistan and the United Nations Office of Outer space Affairs (UNOOSA) signed the cooperation agreement on the establishment of a UN-SPIDER Regional Support Office (RSO) on the occasion of the 47th Scientific and Technical Subcommittee sessions on 12 February 2010.
SUPARCO, the national space agency, was established in 1961 as a Committee and was granted the status of a Commission in 1981. SUPARCO is mandated to conduct R&D in space science, space technology, and their peaceful applications in the country. It works towards developing indigenous capabilities in space technology and promoting space applications for socio-economic uplift of the country.
Address:
Pakistan Space and Upper Atmosphere Research Commission (SUPARCO)
Islamabad Highway,
Islamabad-44000 PakistanMission/Objective:
To provide fast…
read more
The Asia Disaster Reduction Center (ADRC) and the United Nations Office of Outer Space Affairs (UNOOSA) signed the cooperation agreement on establishment of the ADRC UN-SPIDER Regional Support Office (RSO) on the occasion of the 52nd session of the Committee on the Peaceful Uses of Outer Space (COPUOS) on 4th June 2009.
Artificial urban land uses such as commercial and residential buildings, roads, and parking lots covered by impervious surfaces can contribute to the formation of urban heat islands (UHIs), whereas vegetation such as trees, grass, and shrubs can mitigate UHIs. Considering the increasing area of parking lots with little vegetation cover in Nagoya, Japan, this study evaluated the potential for UHI mitigation of greening parking lots in Nagoya. The relationships between land surface temperature (LST) and land use/land cover (LULC) in different seasons were analyzed using multivariate linear regression models. Potential UHI mitigation was then simulated for two scenarios: (1) grass is planted on the surface of each parking lot with coverage from 10 to 100% at an interval of 10% and (2) parking lots are covered by 30% trees and 70% grass. The results show that different LULC types play different roles in different seasons and times. On average, both scenarios slightly…
read moreData from three thermal sensors with different spatial resolution were assessed for urban surface temperature retrieval over the Yokohama City, Japan. The sensors are Thermal Airborne Broadband Imager (TABI), Advanced Spaceborne Thermal Emission and Reflection Radiometer (ASTER) and MODerate resolution Imaging Spectroradiometer (MODIS). Two algorithms were developed for land surface temperature (LST) retrieval from TABI image and ASTER thermal infrared (TIR) channels 13 and 14. In addition, ASTER LST and MODIS LST products were also collected. All the LST images were assessed by analyzing the relationship between LST and normalized difference vegetation index (NDVI) and by spatial distributions of LST profiles, derived from typical transects over the LST images. In this study, a strong negative relationship between LST and NDVI has been demonstrated although the degree of correlation between NDVI and LST varies slightly among the different LST images. Cross-validation…
read moreSatellite images in the thermal infrared can be used for assessing the thermal urban environment as well as for defining heat islands in urban areas. In this paper, the thermal environment of major cities in Greece (Athens, Thessaloniki, Patra, Volos and Heraklion) is examined by using satellite images provided by the Landsat
read more
Enhanced Thematic Mapper (ETM+) sensor on board Landsat 7 platform corresponding to daytime and warm period, when the surface urban heat island (UHI) phenomenon is best observed. The spatial structure of the thermal urban environment is analyzed in each case study and the “hottest” surfaces within the urban settings
are identified and related to the urban surface characteristics and land use. For the needs of the study, the Corine land cover (CLC) database for Greece is used, in an effort to define more effectively the link between emissivities, surface temperatures and urban surface characteristics. Results are examined with…Surface urban heat island (SUHI) is a phenomenon of both high spatial and temporal variability. In this context, studying and monitoring the SUHIs of urban areas through the satellite remote sensing technology, requires land surface temperature (LST) image data from satellite-borne thermal sensors of high spatial resolution as well as temporal resolution. However, due to technical constrains, satellite-borne thermal sensors yield a trade-off between their spatial and temporal resolution; a high spatial resolution is associated with a low temporal resolution and vice versa. To resolve this drawback, we applied in this study four downscaling techniques using different scaling factors to downscale 1-km LST image data provided by the Advanced Very High Resolution Radiometer (AVHRR) sensor, given that AVHRR can offer the highest temporal resolution currently available. The city of Athens in Greece was used as the application site. Downscaled 120-m AVHRR LSTs simulated by…
read moreSatellite images in the thermal infrared can be used for assessing the thermal urban environment as well as for defining heat islands in urban areas. In this study, the thermal environment of major cities in Greece (Athens, Thessaloniki, Patra, Volos and Heraklion) is examined using satellite images provided by the Landsat Enhanced Thematic Mapper (ETM+) sensor on board Landsat 7 satellite corresponding to the daytime and warm period when the surface urban heat island (SUHI) phenomenon is best observed. The spatial structure of the thermal urban environment is analyzed in each case study and the “hottest” surfaces within the urban settings are identified and related to the urban surface characteristics and land use. For the needs of the study, the Corine land cover (CLC) database for Greece is also used, in an effort to define more effectively the link between surface emissivities, land surface temperatures and urban surface characteristics.
read moreA C++ language-based software tool for retrieving land surface temperature (LST) from the data of Landsat TM/ETM+ band6 is developed. It has two main functional modules: (1) Three methods to compute the ground emissivity based on land use/cover classification image, NDVI image and the ratio values of vegetation and bare ground and (2) Converting digital numbers (DNs) from TM/ETM+ band6 to LST. In the software tool, Qin et al.'s mono-window algorithm and Jiménez-Mu?oz and Sobrino's single channel algorithm are programmed to retrieve LST. It will be a useful software tool to study the thermal environment of ground surface or the energy balance between the ground and the bottom atmosphere by using the thermal band of Landsat TM/ETM+.
read more
UN-SPIDER Regional Support Offices with hazard-specific expertise
![]()