")
What are vegetation indices used for?
Vegetation indices derived from Earth observation satellites are important for a wide range of applications such as vegetation monitoring, drought studies, agricultural activities, climate and hydrologic modeling. Vegetation monitoring plays an important role in drought early warning systems, which help to anticipate the risk of food crises at local and global scale.
How are vegetation indices measured from space?
Optical satellite sensors measure the solar radiation reflected from targets on the ground. Multispectral optical sensors are multichannel detectors with a few spectral bands. Each channel is sensitive to radiation within a narrow wavelength band such as the blue, green, red, near infrared, or short wave infrared band. The reflection of radiation by vegetation shows low values in the blue and red band, slightly higher values in the green band, very high values in the near infrared band, and low to high values in the shortwave infrared bands (depending on the wavelength). Very characteristic for the vegetation spectrum is the steep increase of reflectance from red to near infrared, the so called “red edge”. Multispectral sensors do not “see” the whole electromagnetic spectrum but their bands cover parts of the spectrum that are characteristic for different land cover types. (Elowitz, Mark R. “What is Imaging Spectroscopy (Hyperspectral Imaging)?”)
Depending on the intended applications, the design of multispectral sensors differs in number of bands, bandwidth, and wavelengths covered. The sensor RapidEye, for example, was designed for vegetation studies and agricultural applications, and has therefore been especially equipped with a separate red edge band, which is quite unique. The MSi sensor onboard Sentinel-2 will also be equipped with a three new bands in the red-edge region. Commonly used sensors for vegetation studies include the Advanced Very High Resolution Radiometer (AVHRR) onboard NOAA and MetOp, the Moderate-resolution Imaging Spectroradiometer (MODIS) onboard Terra and Aqua, or the VEGETATION 1 and 2 sensors onboard SPOT 4 and SPOT 5.
Spectral indices make use of the characteristics in the spectrum of the respective material of interest. For example, the Normalized Difference Vegetation Index (NDVI) makes use of the red and near infrared bands since the energy reflected in these wavelengths is clearly related to the amount of vegetation cover on the ground surface. Not all spectral indices can be applied to all sensors. When selecting data to calculate indices, the basic requirement is that the the sensor covers the bands used in the index. The index DataBase (IDB) by Henrich et al. gives a comprehensive overview on which indices match with which sensors.
The IDB lists 66 different vegetation indices. In general terms, vegetation indices are dimensionless radiometric measures, which combine information from different channels of the electromagnetic spectrum to enhance the vegetation signal. They measure the spatial and temporal variation of the plant’s photosynthetic activity. Due to their simplicity, vegetation indices are widely used. The most commonly used vegetation indices include: Normalized Difference Vegetation Index (NDVI), Enhanced Vegetation Index (EVI), Difference Vegetation Index (DVI), and others.
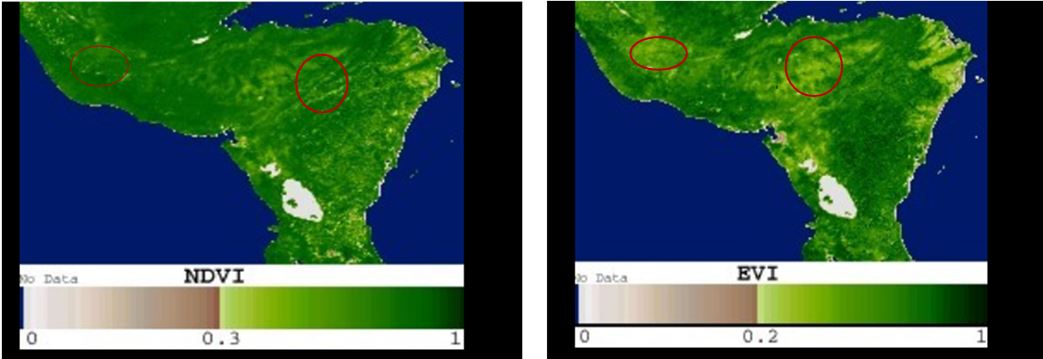
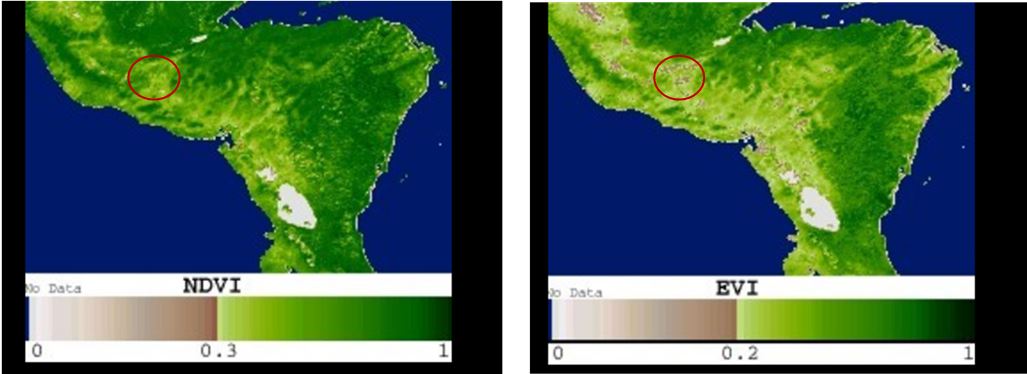
The below images show a comparison of NDVI and EVI based on MODIS for Central America. The data are freely available as MODQ1 product (cf. links to the data below). In the upper image pair data of the wet season in July 2012 show that the NDVI saturates in high biomass areas. The lower image pair with data of the dry season in February 2001 shows that EVI shows lower values in the dry areas, which makes it more difficult to distinguish different biomass. One advantage of EVI is that it includes the blue band making the index less sensitive to atmospheric effects.
In a review paper on vegetation indices and biophysical variables (Clevers 2014, doi:10.1007/978-94-007-7969-3_22), the author states that “Various studies have compared many indices. The performance of the various indices always is different, depending on the specific data sets used for the study, resulting each time in different indices as being the best one. […] One should always consider the theoretical background of an index, its validity range and its purpose, and then use one index as much as possible rendering results that are mutually comparable spatially and temporally”.
Vegetation indices are highly correlated with biophysical variables such as the Leaf Area Index (LAI), Canopy Water, fraction of absorbed photosynthetically active radiation (fAPAR),.and vegetation cover fraction (fCover) the latter two being Essential Climate Variables (ECVs). Radiative transfer models like the PROSAIL model are used to determine the biophysical variables based on reflectance or vegetation indices.
Vegetation indices and their calculation
Vegetation indices use various combinations of multi-spectral satellite data to produce a single image representing vegetative vigor/stress/drought. Crops have a characteristic spectral response pattern in which visible blue and red energy is absorbed strongly, visible green light is reflected weakly (thus a green color) and near infrared energy is very strongly reflected. Because of this characteristic spectral response pattern, many of the vegetation index models use only the red and near-infrared imagery bands. In the past remote sensing based drought indices relied on few optical bands as provided by NOAA AVHRR or Landsat TM sensors, a newer generation tries to use multi band capabilities e.g the MODIS sensor on board terra/aqua satellites an example of which is normalized multi band Drought index NMDI (Wang and Qu 2007).
The Simple Ratio
Numerous vegetation Indices have been formulated, most of which are relate to the simple ratio index first described by Jordan (1969).
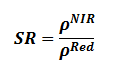
Typical ranges are a little more than 1 for bare soil to more than 20 for dense vegetation. However, the index is more susceptible to division by zero errors and the resulting scale is not linear thus making it difficult to apply statistical procedures.
The Normalized vegetation index - NDVI
It’s a universally acceptable index for drought assessment because of its simplicity in calculation, easy to interpret and its ability to partially compensate for the effects of atmosphere, illumination geometry. The severity of drought situation is assessed by the extent of NDVI deviation from its long term mean.
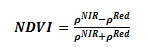
ρNIR and ρRed are reflectance values of Red and Near Infrared bands. The index contrasts the absorption features of chlorophyll in the red region of the electromagnetic spectrum and the strong reflectance of the near infra-red region The resulting index value is sensitive to the presence of vegetation and can be used to address issues of vegetation type, amount, and condition. The measurement scale has a desirable characteristics of producing values in the range of -1.0 to 1.0, where vegetated areas will typically have values greater than zero and negative values indicate non-vegetated surface features such as water, barren, ice, snow, or clouds, while the RVI ranges from 0 to infinity. In addition to the above divisions by zero are significantly reduced. This index is sensitive at low levels of vegetative cover, as compared to SR that is more sensitive to variations in dense canopies.
Enhanced Vegetation Index - EVI
This was meant to improve the quality of NDVI since it corrects for some distortions in the reflected light caused by the particles in the air as well as the ground cover below the vegetation.
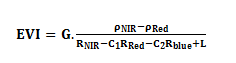
ρNIR and ρRed and ρblue are reflectance values of Red , Near Infrared and blue bands whereas; C1 and C2 are atmosphere resistance red and blue coefficients respectively L is the canopy background brightness correction factor and G is gain factor Neither the NDVI nor the EVI product will eliminate all obstacles. Clouds and aerosols can often block the satellites’ view of the surface entirely, glare from the sun can saturate certain pixels, and temporary malfunctions in the satellite instruments themselves can distort an image. Longer term averages of vegetation data help remove errors caused by clouds, but removes detail, especially at high spatial resolutions Kogan (1990).
Vegetation Condition Index - VCI
This index was first suggested by Kogan (1995 and 1997). It shows, effectively, how close the current month’s NDVI is to the minimum NDVI calculated from the long-term record of remote sensing images.
![]()
The VCI values between 50 to 100 % indicate optimal or above-normal conditions. At the VCI value of 100% the NDVI value for this month (or week) is equal to NDVImax. Different degrees of a drought severity are indicated by VCI values below 50%.
FAO’s Agricultural Stress Index System - ASIS
FAO makes use of the Vegetation Health Index (VHI) that combines two indexes: the Vegetation Condition Index (VCI) and the Temperature Condition Index (TCI). The VCI is derived from the NDVI using the equation, which can be seen in the paragraph above
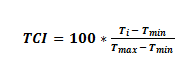
The TCI is similar to the VCI, but it is derived from Temperature measurements estimated by the infrared band of the AVHRR sensor (channel 4). Kogan (1995) proposed this temperature index to remove the distorting effect of clouds on satellite assessment of vegetation, since channel 4 is less sensitive to water vapour content in the atmosphere than the visible light channels. The mathematical formulation of the TCI is:.
The VHI is represented as a linear combination of the VCI and the TCI.
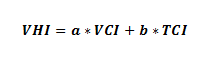
The parameters “a” and “b” have different weights depending on the crop being analysed. Under near normal conditions, vegetation is more sensitive to humidity during canopy formation and to temperature during flowering.
How can I access vegetation indices?
Some vegetation indices are available as free geoinformation items with global coverage and frequent updates, for example:
STAR Global Vegetation Health Products (NOAA) (link to the data)
Agricultural Stress Index System (ASIS, FAO) (link to the data)
Locust Watch (IRI) (link to the data)
Global Agricultural Drought Monitoring and Forecasting System (GADMFS-CSISS) (link to the data)
Famine Early Warning Systems (FEWS NET, USGS) (link to the data)
MODIS Vegetation products (NASA) (link to the data)
NDVI Central Asia (FEWS NET-USGS, USAID) (link to the data)
NDVI Middle East (FEWS NET-USGS, USAID) (link to the data)
NDVI Central America (FEWS NET-USGS, USAID) (link to the data)
NDVI Africa (FEWS NET-USGS, USAID) (link to the data)
How are the datasets used for disaster risk management and emergency response?
Vegetation indices, especially the freely available time series of NDVI and EVI, are commonly used in drought monitoring. The Iranian Space Agency, one of UN-SPIDER Regional Support Offices, has prepared a recommended practice on drought monitoring, which is used for monitoring the impacts of meteorological drought on natural vegetation, i.e. rain fed, range land, and forest. Based on maximum value composites of MODIS NDVI (250m spatial resolution), the Vegetation Condition Index (VCI) is calculated to assess whether the state of the vegetation in a current month is better or worse compared to same month of the previous years. The values range between zero and one: a value of one indicates that the NDVI value of the current month is the maximum of the time series; a value of zero indicates that the NDVI value of the current month is the minimum of the time series; and all values in between indicate where the observed value is situated between the maximum and minimum. Detailed step-by-step procedures how to prepare the MODIS data, how to calculate the VCI, and how to visualize the results are available here on the Knowledge Portal.
References
Jordan, C.F. 1969. Derivation of leaf Area Index from Quality of Light on the Forest Floor. Ecology, 50: 663-666.
Kogan F.N. 1990. Remote Sensing of Weather Impacts on Vegetation in Homogeneous Areas. Int. J. Remote sensing, 11:1405-1419
Kogan F.N. 1995. Application of Vegetation Index and Brightness Temperature for Drought Detection. Adv. Space Research, 11:91-100.
Kogan F.N. 1997. Global Drought Watch Space. Bull Am.soc.met., 78:621-636.
LONG X., ZHEN L. ,CHENG S. et al. 2011 Quantitative Assessment and Spatial Characteristics of Agricultural Drought Risk in the Jinghe Watershed, Northwestern China[J]. Journal of Resources and Ecology, 2(4): 338-344.
Rouse, J., Hass, R., Schell, J. 1973. Deering, D. Monitoring Vegetation Systems in the Great Plains with ERTS. Third ERTS Symposium, NASA, SP-351 I, 309-317.
Wang, L. and Qu, J.J. 2007. NMDI: A Normalized Multi Band Drought Index for Monitoring Soil and Vegetation Moisture with Satellite Remote Sensing. Geophys. Res. Left., 34, L20405