United
Nations
Office for Outer Space Affairs
UN-SPIDER Knowledge Portal
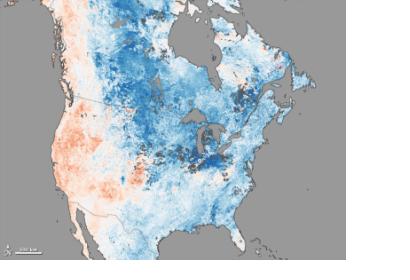
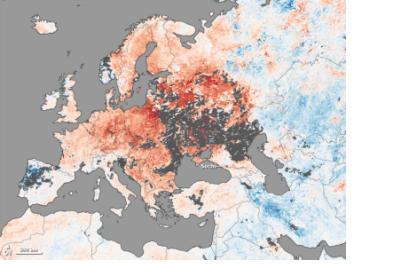
NASA satellite data shows the recent weather divergences on Earth - particularly in North America and Europe. At the beginning of 2014 the temperatures in the northern hemisphere showed how the atmosphere can produce two contrasting weather extremes at the same time. While in northern America the temperatures fell way below zero, most of Europe enjoyed temperatures of +10 degrees Celsius.
What connects both events are giant meanders in high-altitude winds known as Rossby waves. These planetary-scale waves define the jet stream and do much to determine the type of weather any given area will face over periods of days to weeks. However, the waves are also governed by fundamental laws of fluid dynamics and thermodynamics that ensure the total amount of energy circulating through the global atmosphere does not change, despite the weather extremes in one area or another.
The data acquired by the Moderate Resolution Imaging Spectroradiometer (MODIS) on NASA’s satellite Terra show how cold or warm it was in both regions in comparison to the last ten years. Areas with warmer than average temperature are mapped in red, near normal are white, areas that were cooler this year are shown in blue. The grey areas could not be seen by the satellite because clouds blocked the sensor.

