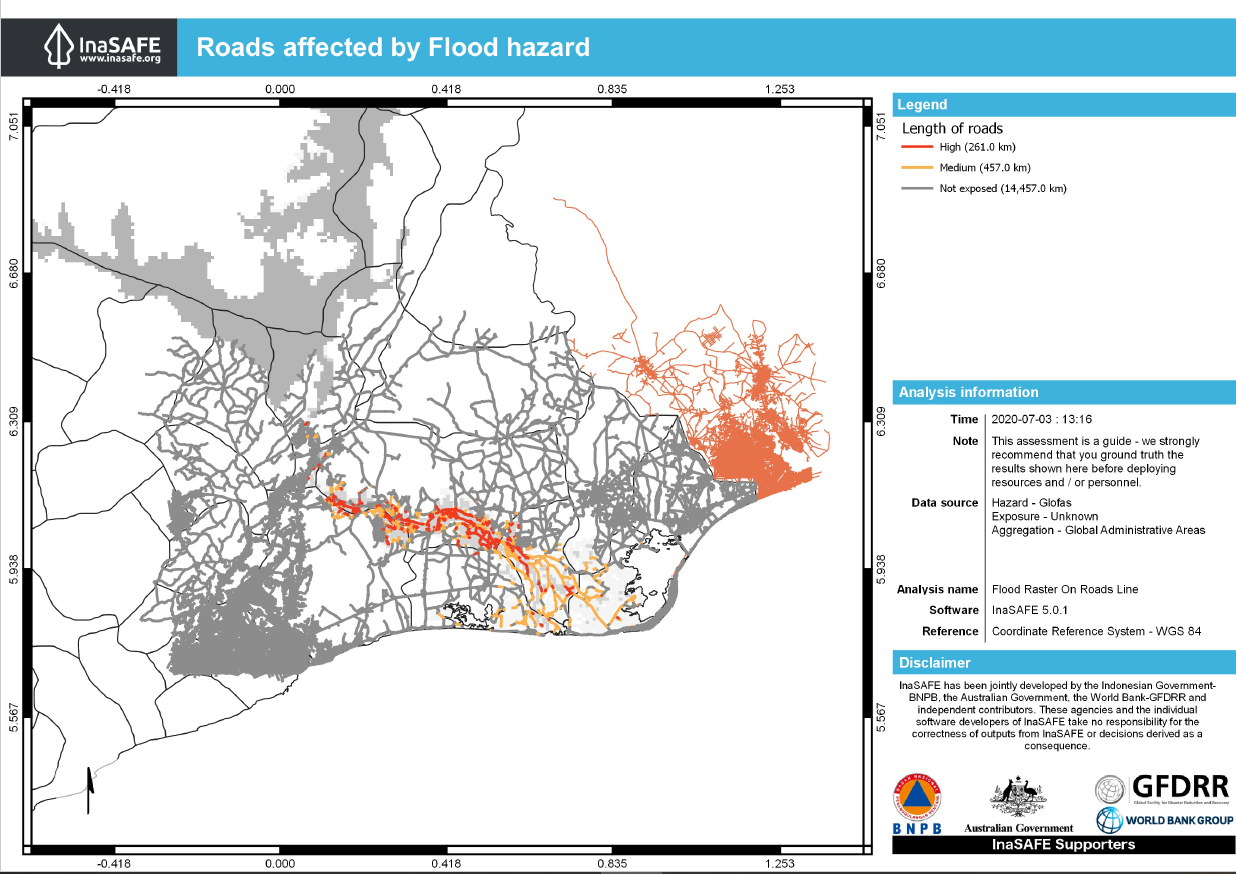
The present case study on free software extensions addresses the coastal area east of Accra in Ghana, Western Africa. The analysis will be realized with a flood layer from the Global Flood Awareness System (GloFAS) of the Joint Research Centre (JRC) of the European Commission, which provides a possible flood extent of a 100-year flood and supports assessing the number of people that would be affected by such an event. GloFAS data is made available through a Web Map Service (WMS) and contains datasets giving flood forecasts based on hydro-meteorological datasets and modelling.
A second case study focuses on the coastal area east of Accra in Ghana, Western Africa, and can be accessed here.
Required software setup before continuing with the next steps
First of all, open a new QGIS Project and open the "PlugIn Library". Open the function “Manage and Install Plugins” and search for “InaSAFE”. Install the plug-in to be ready for the following workflow.
Repeat this process and add the "QuickOSM" plug-in to QGIS.
Case Study: Accra, Ghana
For the Case Study on Ghana we will work with the following data products:
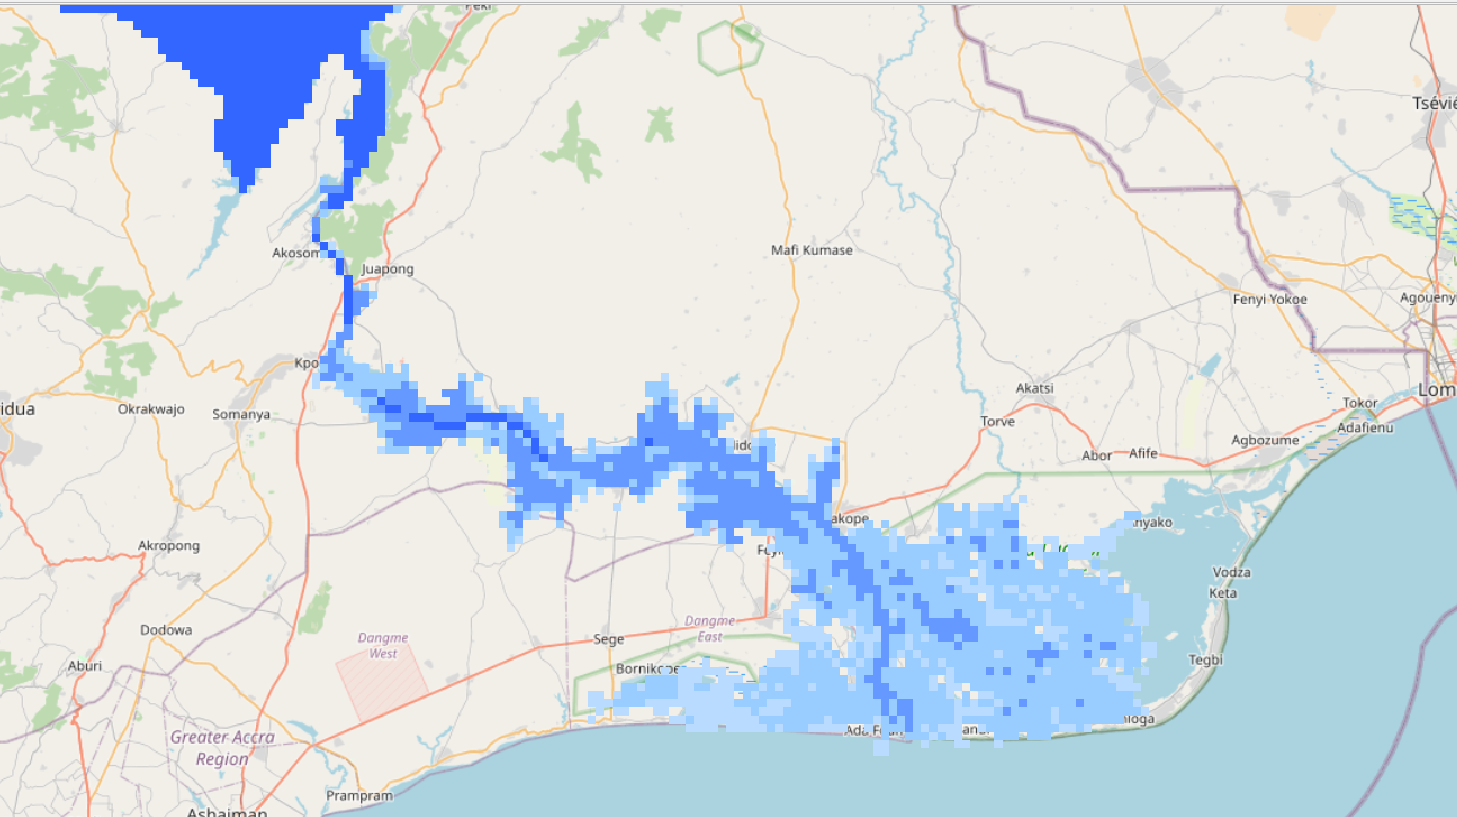
- GloFAS layer on 100-year flood event
- OSM data on roads in Eastern Accra
- Population layer for Ghana from the Humantarian Data Exchange (HDX) "gha_ppp_2020.tif" under: https://data.humdata.org/dataset/worldpop-population-counts-for-ghana
- Global administrative areas of Ghana, selecting the Shapefile under: https://gadm.org/download_country_v3.html
Please download the Population layer & administrative areas from the respective websites. The other data sources will be added in the next step.
1. Data Access
1.1 WMS
WebMapping Service provide up-to-date information from several providers and can be loaded into a QGIS project using a URL.
For the analysis of the 100-year returning event in Ghana we use data from the GloFAS WMS. To add a WMS layer click on "Layer" and "Add Layer", then click on “Create a New WMS/WMTS Connection".
Add the URL:
http://globalfloods-ows.ecmwf.int/glofas-ows/ows.py
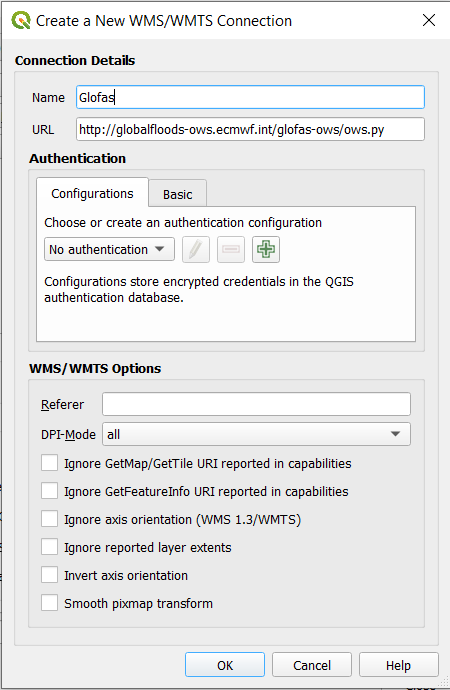
Select the Layer “100-year event” and load it into your QGIS project.
1.2 QuickOSM
Open the QuickOSM plug-in. The query will be done with the key “Highways”, leave the value blank and use the drop down arrow to select the field "Canvas extent" (please be sure to zoom in on the area shown below). Set the timeout up to 100 seconds under the section "Advanced" to be sure the query will be completed. This can take some moments as there are many houses added as a layer to your project. Save the layer as a Shapefile in a folder to your hard drive.
1.3 Population Layer
Add the population GeoTiff from HumData for Ghana to your QGIS project.
Use the “Extract by Mask” Function to cut the population raster, using the same canvas extent as for the OSM data. Save the created layer as a GeoTiff on your hard drive.
1.4 Administrative Areas
Add the Administrative Areas from Ghana from GADM to your QGIS project.
Load the shapefile into your QGIS project.
2) Data processing
We have to preprocess the raster data to be sure that the analysis will be fast and will not resut in any errors. We have to save the WMS raster as a GeoTiff to be able to use it in the QGIS project as the InaSAFE analysis requires to take the information from the hard drive of your device.
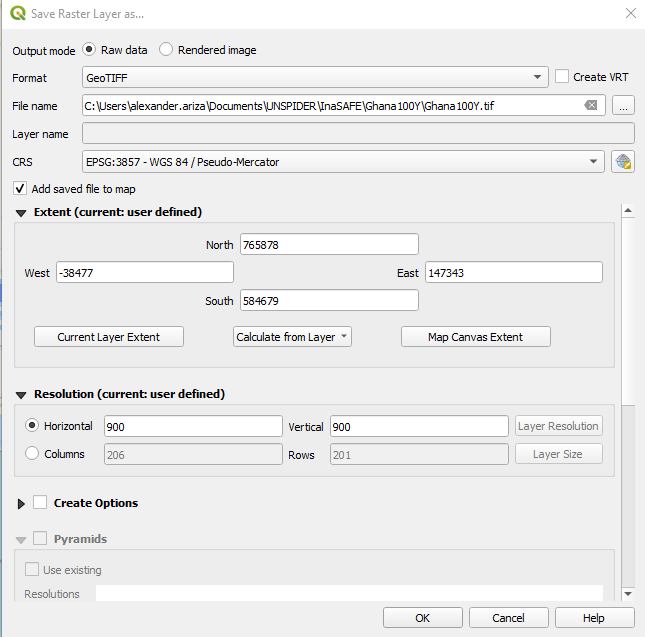
2.1) Save the raster file as GeoTIFF
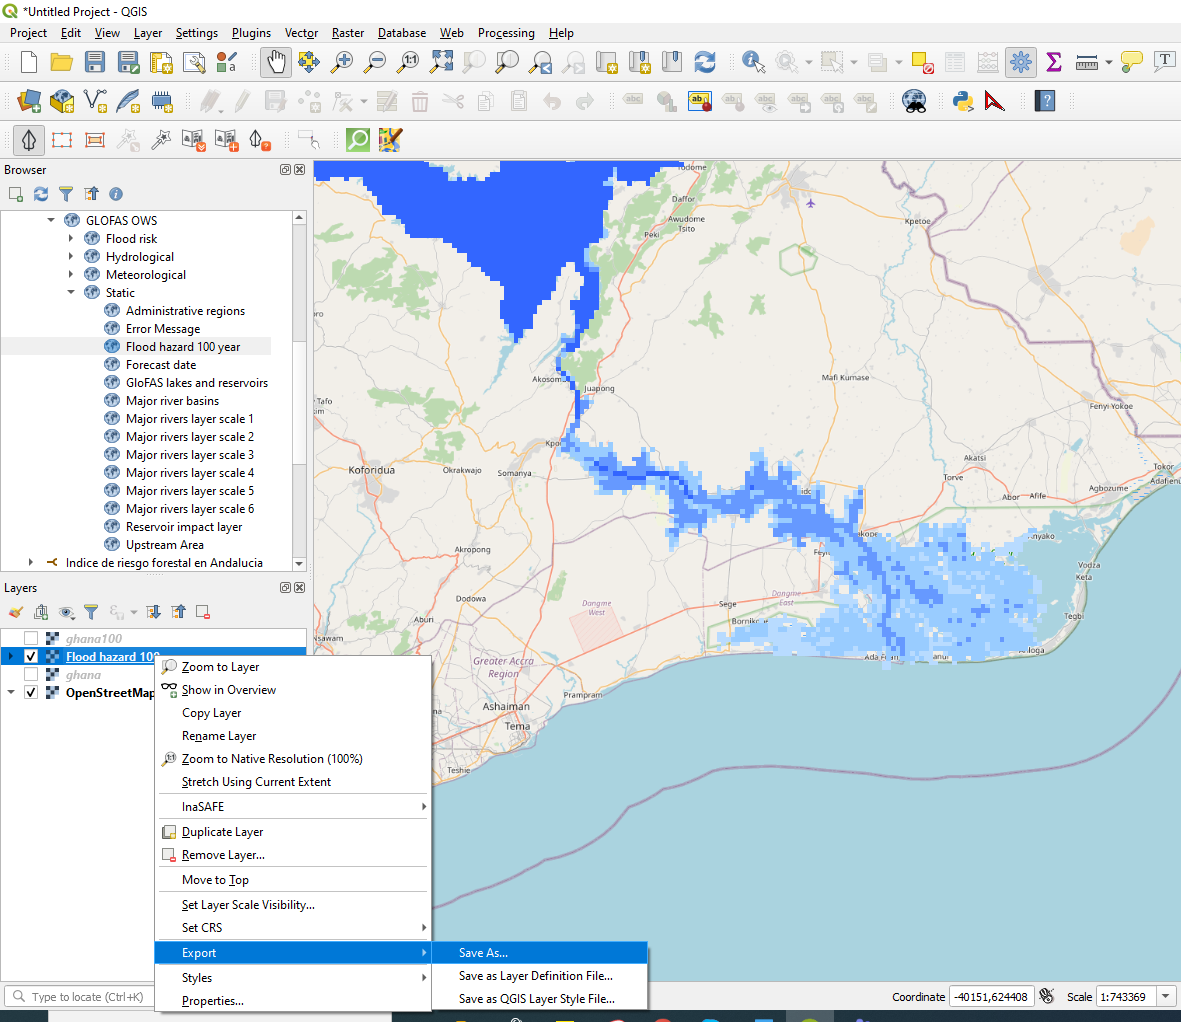
In continuation select the following export options:
- "Raw Data"
- Deactivate VRS, it is not necessary
- Select a folder on your hard drive to save the Tiff
- Select a layer name
- Choose the right coordinate system (EPSG: 3857- WGS 84/Pseudo Mercator)
- Select the extent of the Tiff using the “Canvas Layer Extent” option
- Resolution needs to be 900m for this product
Another possibility for data extract is given in this section.
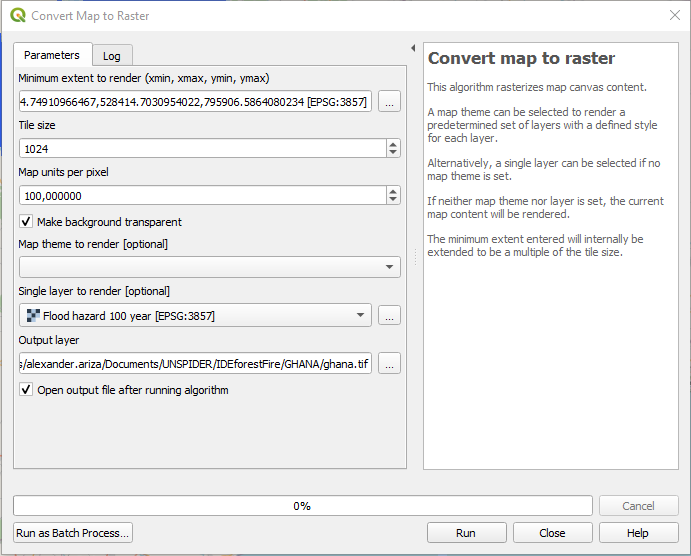
2.2 Convert map into raster
For the minimum extent we choose the “Select Extend on Canvas” to capture the same area as before. We leave the tile size on default for the best resolution. We choose the option to "make the background transparent" and choose the layer for clipping. Finally we choose the directory on our hard drive where the Geotiff will be stored.
3. Configuration of the Keyword Wizard in InaSAFE
Open the InaSAFE Question Form on the right hand side of your screen. As you see, there are no layers available for the analysis, so the keywords need to be specified.
 Click on this button to open the Keyword Creation Wizard. Be aware, that you select the according layer beforehand, so the Wizard recognizes the right layer for the configuration.
3.1 Hazard layer configuration
For the Flood Layer use the following: Please select "Hazard", then "Flood", then "Multiple events" as it is a forecast for the 100-years return period. We then choose "Band 1" and "Classified" and select the option for "Generic classes", so we can create our own classes. Please select the thresholds according to these values:
- Classes with Band1: Low (under 1 meter flooded) <180
- Moderate (1-3 meter flooded) 150-180
- High (3-10 Meter flooded) 60-150
- Exclusion (permanent waterbodies) <60
Do not forget to indicate the data source and title “Ghana Floods”.
3.2 Roads layer configuration
Repeat the process for the exposure layer by selecting "Exposure", then "Structure" for the buildings layer. Select "Generic Structure Classification" to obtain the structure from OpenStreetMap or customize this classification. Distribute the highway classes according to their belonging and move the rather ambiguous categories to Other. Proceed with the Wizard as before and add a data source and a title to the layer.
3.3 Population layer configuration
For the population grid we choose "Exposure", then "Population" and "Band 1". Further we have to choose "Continuous" and "Count" as the value of each pixel provides the "Count of Population" living in the area. We then then add UN OCHA as a data source and choose a layer title.
As you see, the configuration with the Keywords Wizard is quite similar to the other case study in Mozambique.
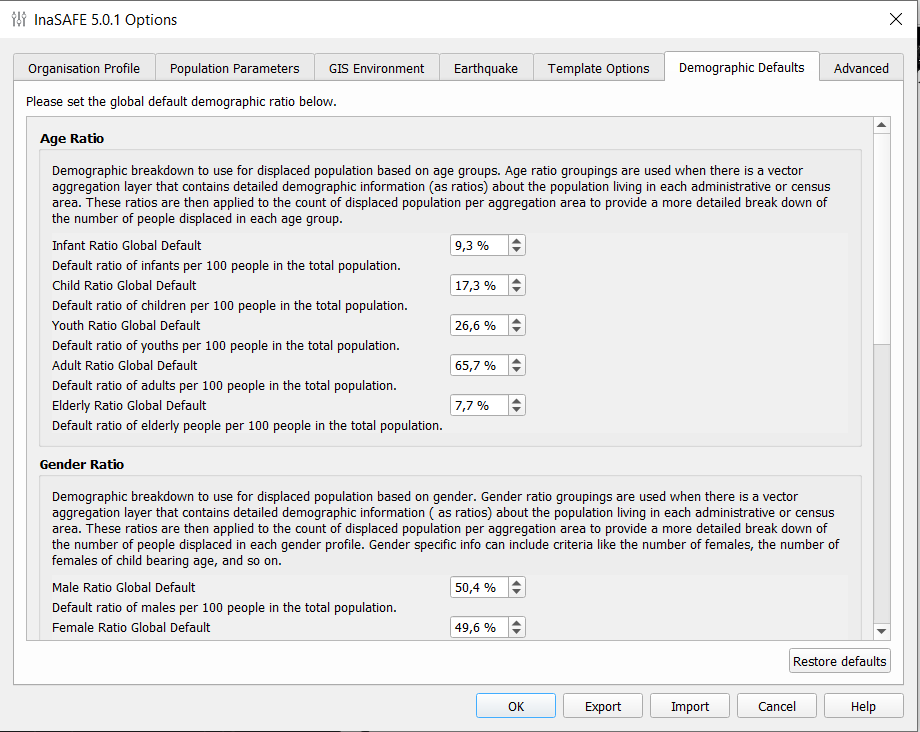
4. Adapt important population rates
This step is necessary to adapt the ratios in the demographic defaults to the percentages of the local population. Every country has different demographic configurations that need to be considered in the further steps. As the population in Ghana is quite young, there are more children than older people than in other parts of the world. This has to be considered in disaster risk planning. In the general settings adapt the percentages as follows:
- Infant Ratio(>=4): no values (Please leave the default value)
- Child Ratio (5-14): no values (Please leave the default value)
- Youth Ratio (0-14): 37.83%
- Adult (15-64): 57,87%
- Elderly (>65): 4.3%
- Male: 49,5 %
- Female: 50,5%
- Disability Ratio: no values
Leave the other values on default, as there are no more specific values for Ghana in this case study.
5. Adapt the aggregation layer keywords
If you wish to use the aggregation of administrative areas configure the keyword for the aggregation areas as well and choose the field “NAME_3”, click then on “Globals” as we then do not have more detailed information of certain administrative areas and will use the predefined demographic values.
6. Run analysis
Run the Analysis with InaSAFE using the "Floods Layer", one of the Exposure Layers and if you wish the "Aggregation Layer".