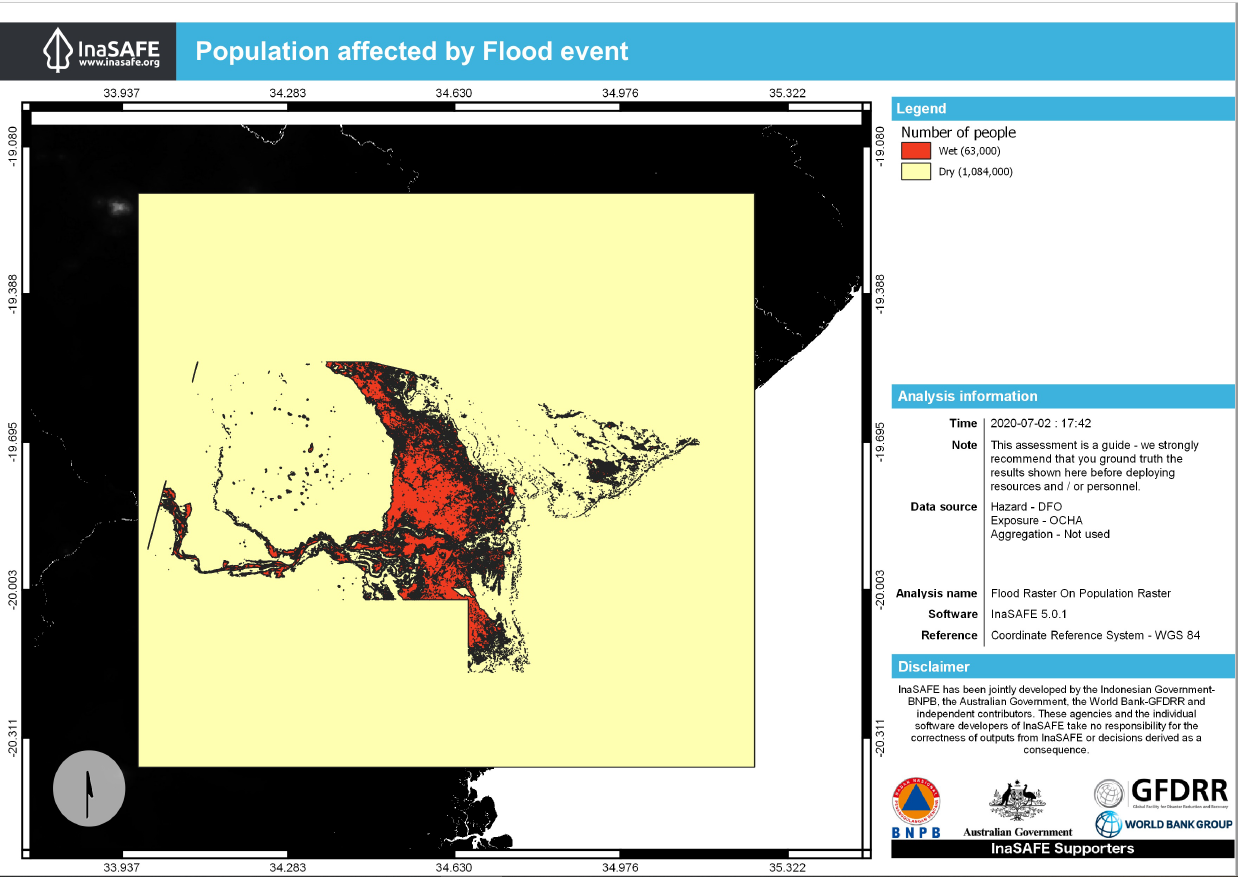
The Recommended Practice is using two case studies. The present case study is set in Beira, Mozambique, and uses the flood extent from floods following Cyclone Idai in 2019 as a basis. It estimates the amount of people and structures that would be damaged if a similar event reoccured. For this analysis, data from the Dartmouth Flood Observatory and freely available exposure data will be combined. The practice uses information on flood zones and infrastructure, such as buildings or roads, through several Web Map Services (WMS), which are imported into QGIS. They can be accessed free of charge, as can all other data sources used.
A second case study focuses on the coastal area east of Accra in Ghana, Western Africa, and can be accessed here.
Software setup required before continuing with the next steps
First of all, open a new QGIS Project and open the PlugIn Library. Open the Function “Manage and Install Plugins” and search for “InaSAFE”. Install the Plugin to be ready for the following workflow.
Repeat this process and add the "QuickOSM" PlugIn to QGIS.
Case Study 1: Beira, Mozambique
For the Case Study on Mozambique we will work with the following data products:
- DFO Layer on Flood Extent 2019 in Mozambique
- OSM Data of Buildings in Beira
- Population Layer of Mozambique from Humantarian Data Exchange "moz_ppp_2020.tif" under: https://data.humdata.org/dataset/worldpop-population-counts-for-mozambique
Please download the Population Layer from the according website. The other Data Sources will be added in the next step.
1. Data Access
1.1 WMS
WebMapping Service provide up-to-date information from several providers and can be loaded into a QGIS Project using a URL.
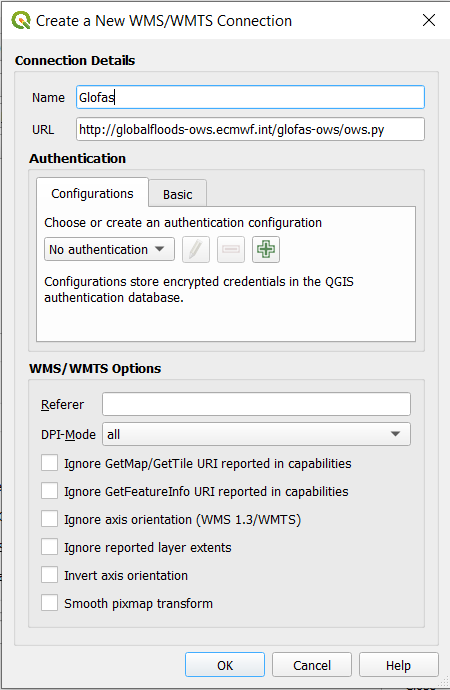
For the analysis of the Beira Floodings in 2019 we will use the DFO WMS. To add a WMS Layer click on "Layer" and "Add Layer", then click on “Create a New WMS/WMTS Connection".
Add the URL:
You will click on OK and then push the button Connect. Choose then the layer named “Event 4725” If the field throws an error, reopen your QGIS Project and check the spellings before trying again.
1.2 QuickOSM
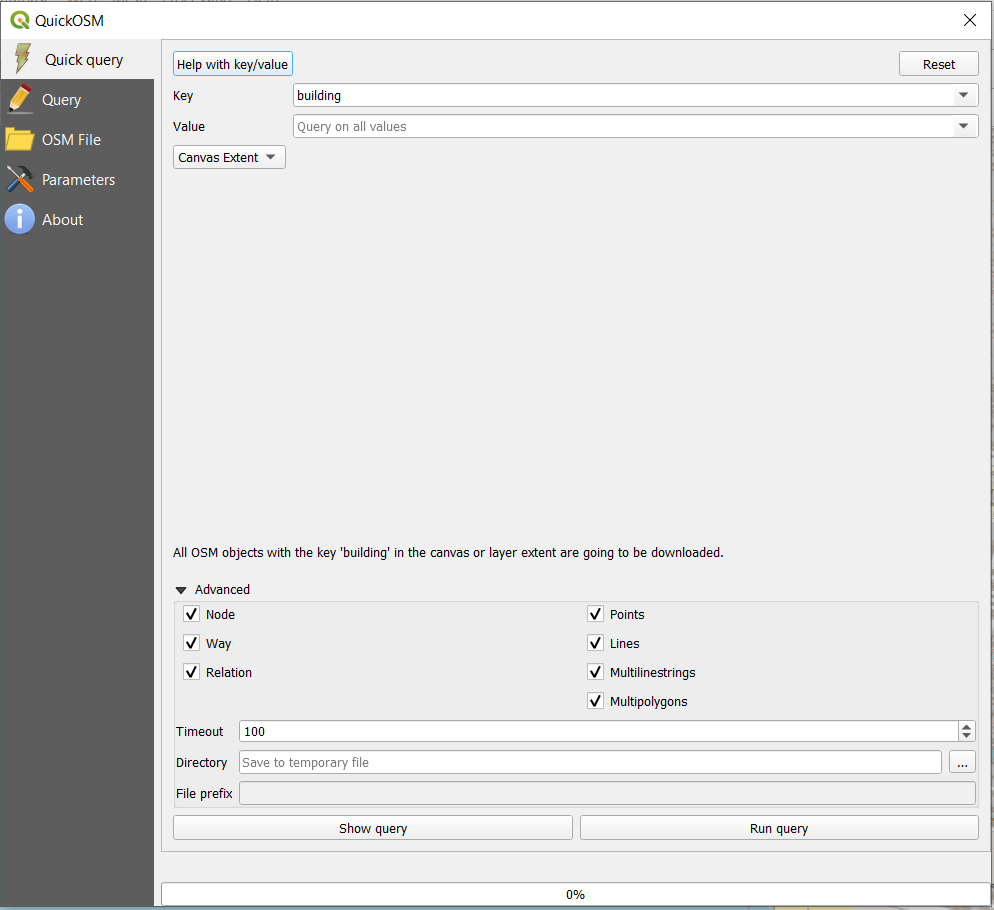
Open the Query field of the QuickOSM PlugIn. The query will be done with the Key “Building”, leave the Value blank and using the drop down arrow select the field "Canvas Extent" (please be sure to zoom in on the area of Beira and only show the parts that can be seen in the Floods Layer Event 4725). Set the timeout up to 100 seconds under the section "Advanced" to be sure the query will be completed. This can take some moment as there are many houses added as a Layer to your project. Save the Layer as a Shapefile in a folder to your harddrive.
1.3 Population Layer
Add the Population GeoTiff from HumData from Mozambique to your QGIS Project
Use the “Extract by Mask” Function to cut the Population Raster, using the same canvas Extent as for the OSM Data as well. Save the created Layer as a GeoTiff on your hardrive.
2) Data Processing
We have to preprocess the raster data to be sure, that the analysis will be fast and will not throw any error. We have to save the WMS raster as a GeoTiff to be able to use it in the QGIS project as the InaSAFE Analysis requires to take the information from the hard drive of your device.
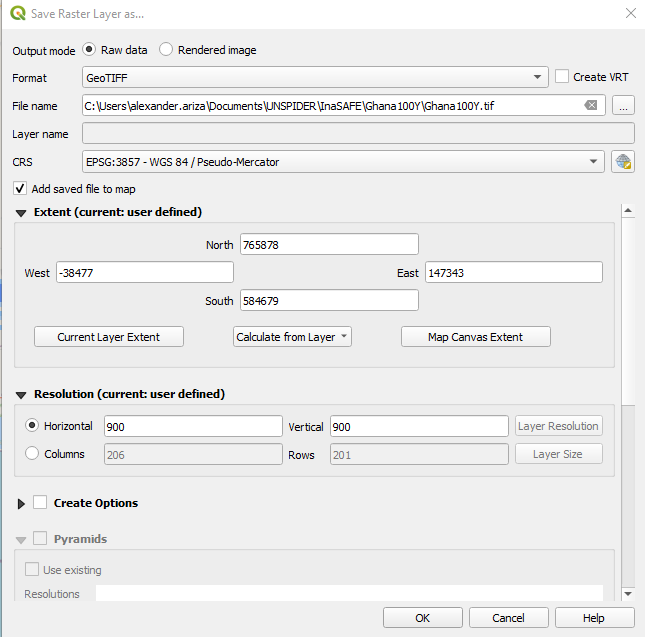
2.1) Save the Raster File as GeoTIFF
In continuation select the following export options:
- "Raw Data"
- Deactivate VRS, it is not necessary
- Select a Folder on your harddrive, where you want to save the Tiff
- Select a Layer Name
- Choose the right Coordinate System (EPSG: 3857- WGS 84/Pseudo Mercator)
- Select the Extent of the Tiff using the “Canvas Layer Extent” option
- Resolution needs to be 900m for this product
Another possibility for data extract is given in this section.
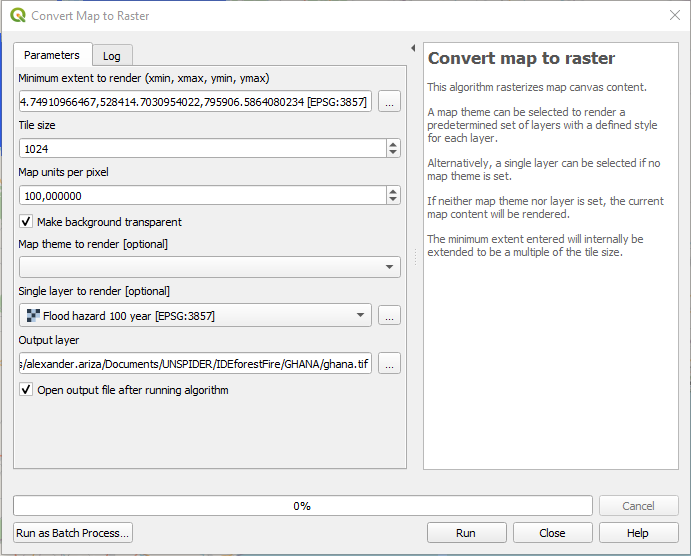
2.2 Convert map into raster
For the minimum extent we choose the “Select Extend on Canvas” to capture the same area as before. We leave the tile size the same to get the best resolution. We choose the option to "make the background transparent" and choose the layer for clipping. Finally we choose the directory on our hard drive where the Geotiff will be stored.
3. Configuration of the Keyword Wizard in InaSAFE
Open the InaSAFE Question Form on the right hand side of your Screen. As you see, there are no layers available for the analysis, so the Keywords need to be specified.
 Click on this button to open the Keyword Creation Wizard. Be aware, that you select the according layer beforehand, so the Wizard recognizes the right layer for the configuration.
3.1 Hazard Layer Configuration
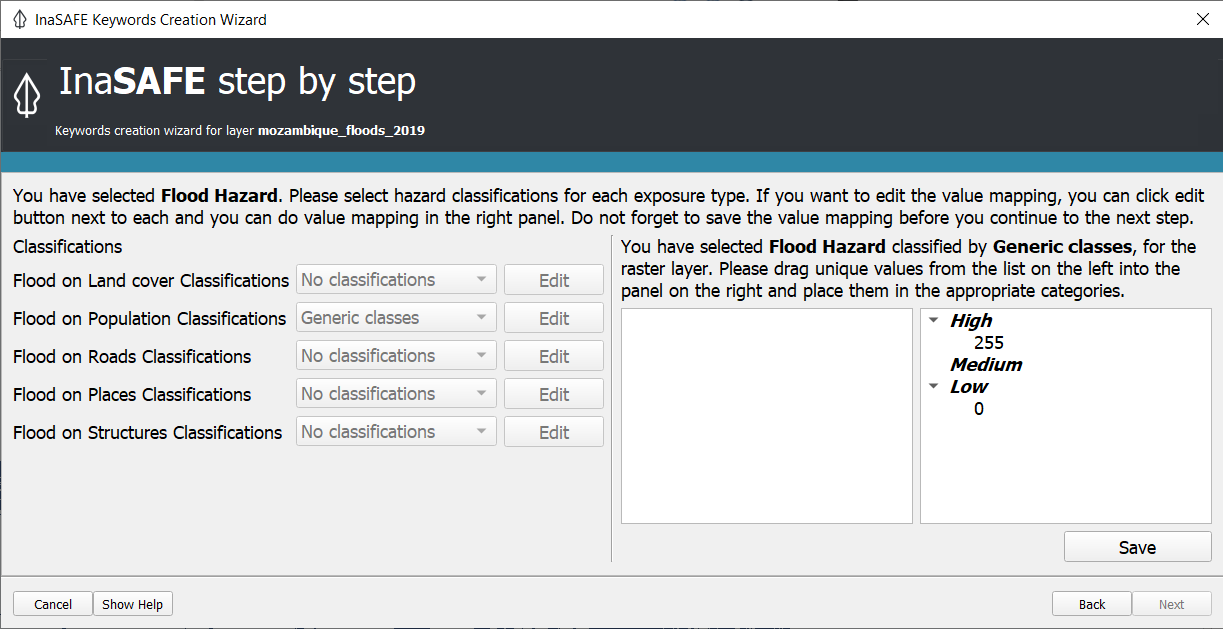
For the Flood Layer use the following: Please select "Hazard", then "Flood", then "Single event" and then "Band 1". The data we use is classified, as it shows the flooded area and the unflooded area. Then select the “Generic Classes” for Population and Structures. Click on Save and Next and add “DFO” as Data Source and if you wish more of the Metadata. Skip the Extra Information Tab and add the title “Floods in Mozambique 2019”. Finally click on Finish.
3.2 Buildings Layer Configuration
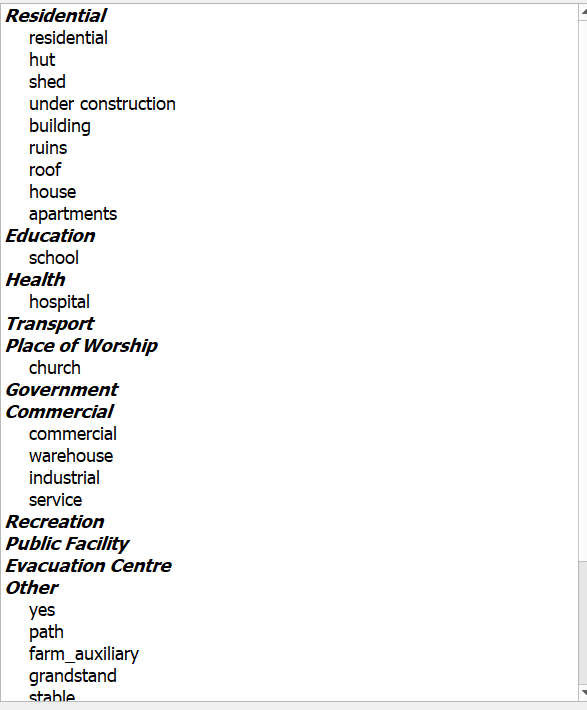
Repeat the process for the Exposure Layer by selecting "Exposure", then "Structure" for the buildings Layer. Select "Generic Structure Classification" to obtain the Structure from OpenStreetMap or customize this Classification. Distribute the House classes according to their belonging and move the rather ambiguous categories to Other. Proceed with the Wizard as before and Add a data source and a Title to the Layer.
3.3 Population Layer Configuration
For the Population Layer the same steps have to be taken. Open the Key Creation Wizard again and select "Exposure", then "Population" and "Continuous". We will use the "Count" and will add "OCHA" as data source. Then click on Finish.
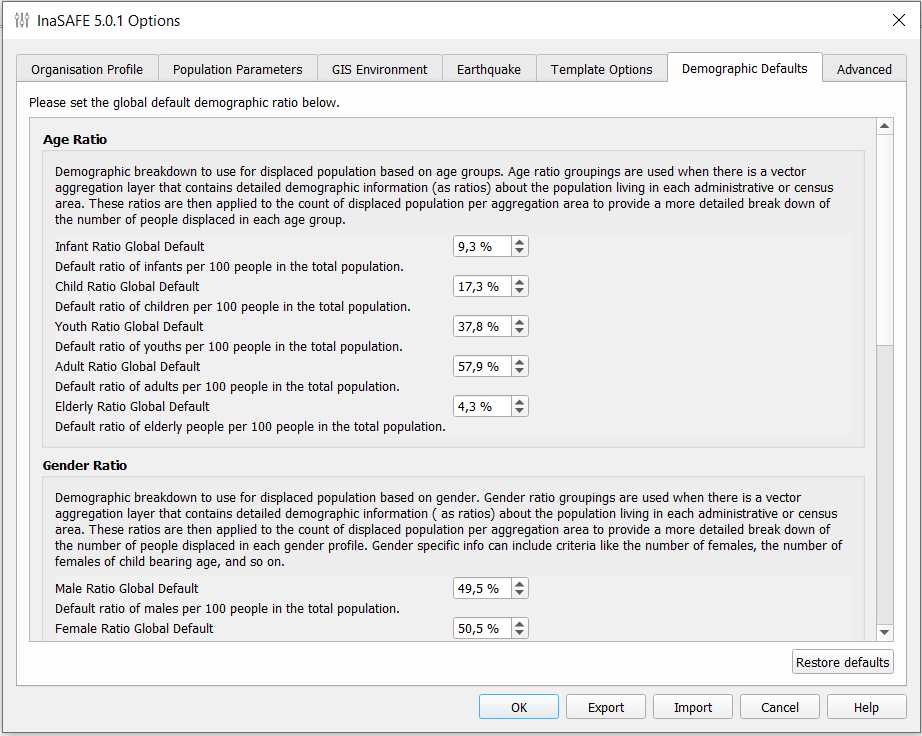
4. Adapt important population rates
This step is necessary to adapt the ratios in the Demographic Defaults to the percentages of the local population. Every country has different demographic configurations that need to be considered in the further steps. As the population in Mozambique is quite young, there are more children than older people than in other parts of the world. This has to be considered in the Disaster Risk Planning. In the general settings adapt the Percentages as Follows:
- Infant Ratio(>=4): no values (Please leave the default value)
- Child Ratio (5-14): no values (Please leave the default value)
- Youth Ratio (0-14): 39,0%
- Adult (15-64): 58,5%
- Elderly (>65): 2,5%
- Male: 49,9 %
- Female: 50,1%
- Disability Ratio: 2% (2017 Census estimates 1.5%, so we approach this by using 2.0%)
Leave the other values as they are, as there are no more specific values for Mozambique in this case study.
5. Run Analysis
Run the Analysis several times and try out, how the results are returned. Try out the different Exposure Layers and the Population Layer and save the created Layer and the pdfs using the “Print” Function.