Many definitions of "drought" have accumulated over the time, but none of those can satisfy a meteorologist, a farmer and a hydrologist at the same time, as "drought" has a different meaning for every single one of them. In 1993 McKee et al. published the article "The Relation of Drought Frequency and Duration to Time Scales" in which they introduced the "Standardized Precipitation Index" (SPI) as a proxi for precipitation related droughts. To this day, the SPI is used world wide to address precipitation information when it comes to drought like conditions. The WMO recognized the SPI as an powerful and easy to use index in 2012 within this publication. Even though Vicente-Serrano et al. added the missing component of the evapotranspiration in 2010 with the "Standardized Precipitation Evapotraspiration Index" (SPEI), the SPI is still widely used when it comes to droughts or precipitation analyses.
For related information and drought definitions see the related recommended practice on drought monitoring using the Standardized Vegetation Index.
Definition of the SPI
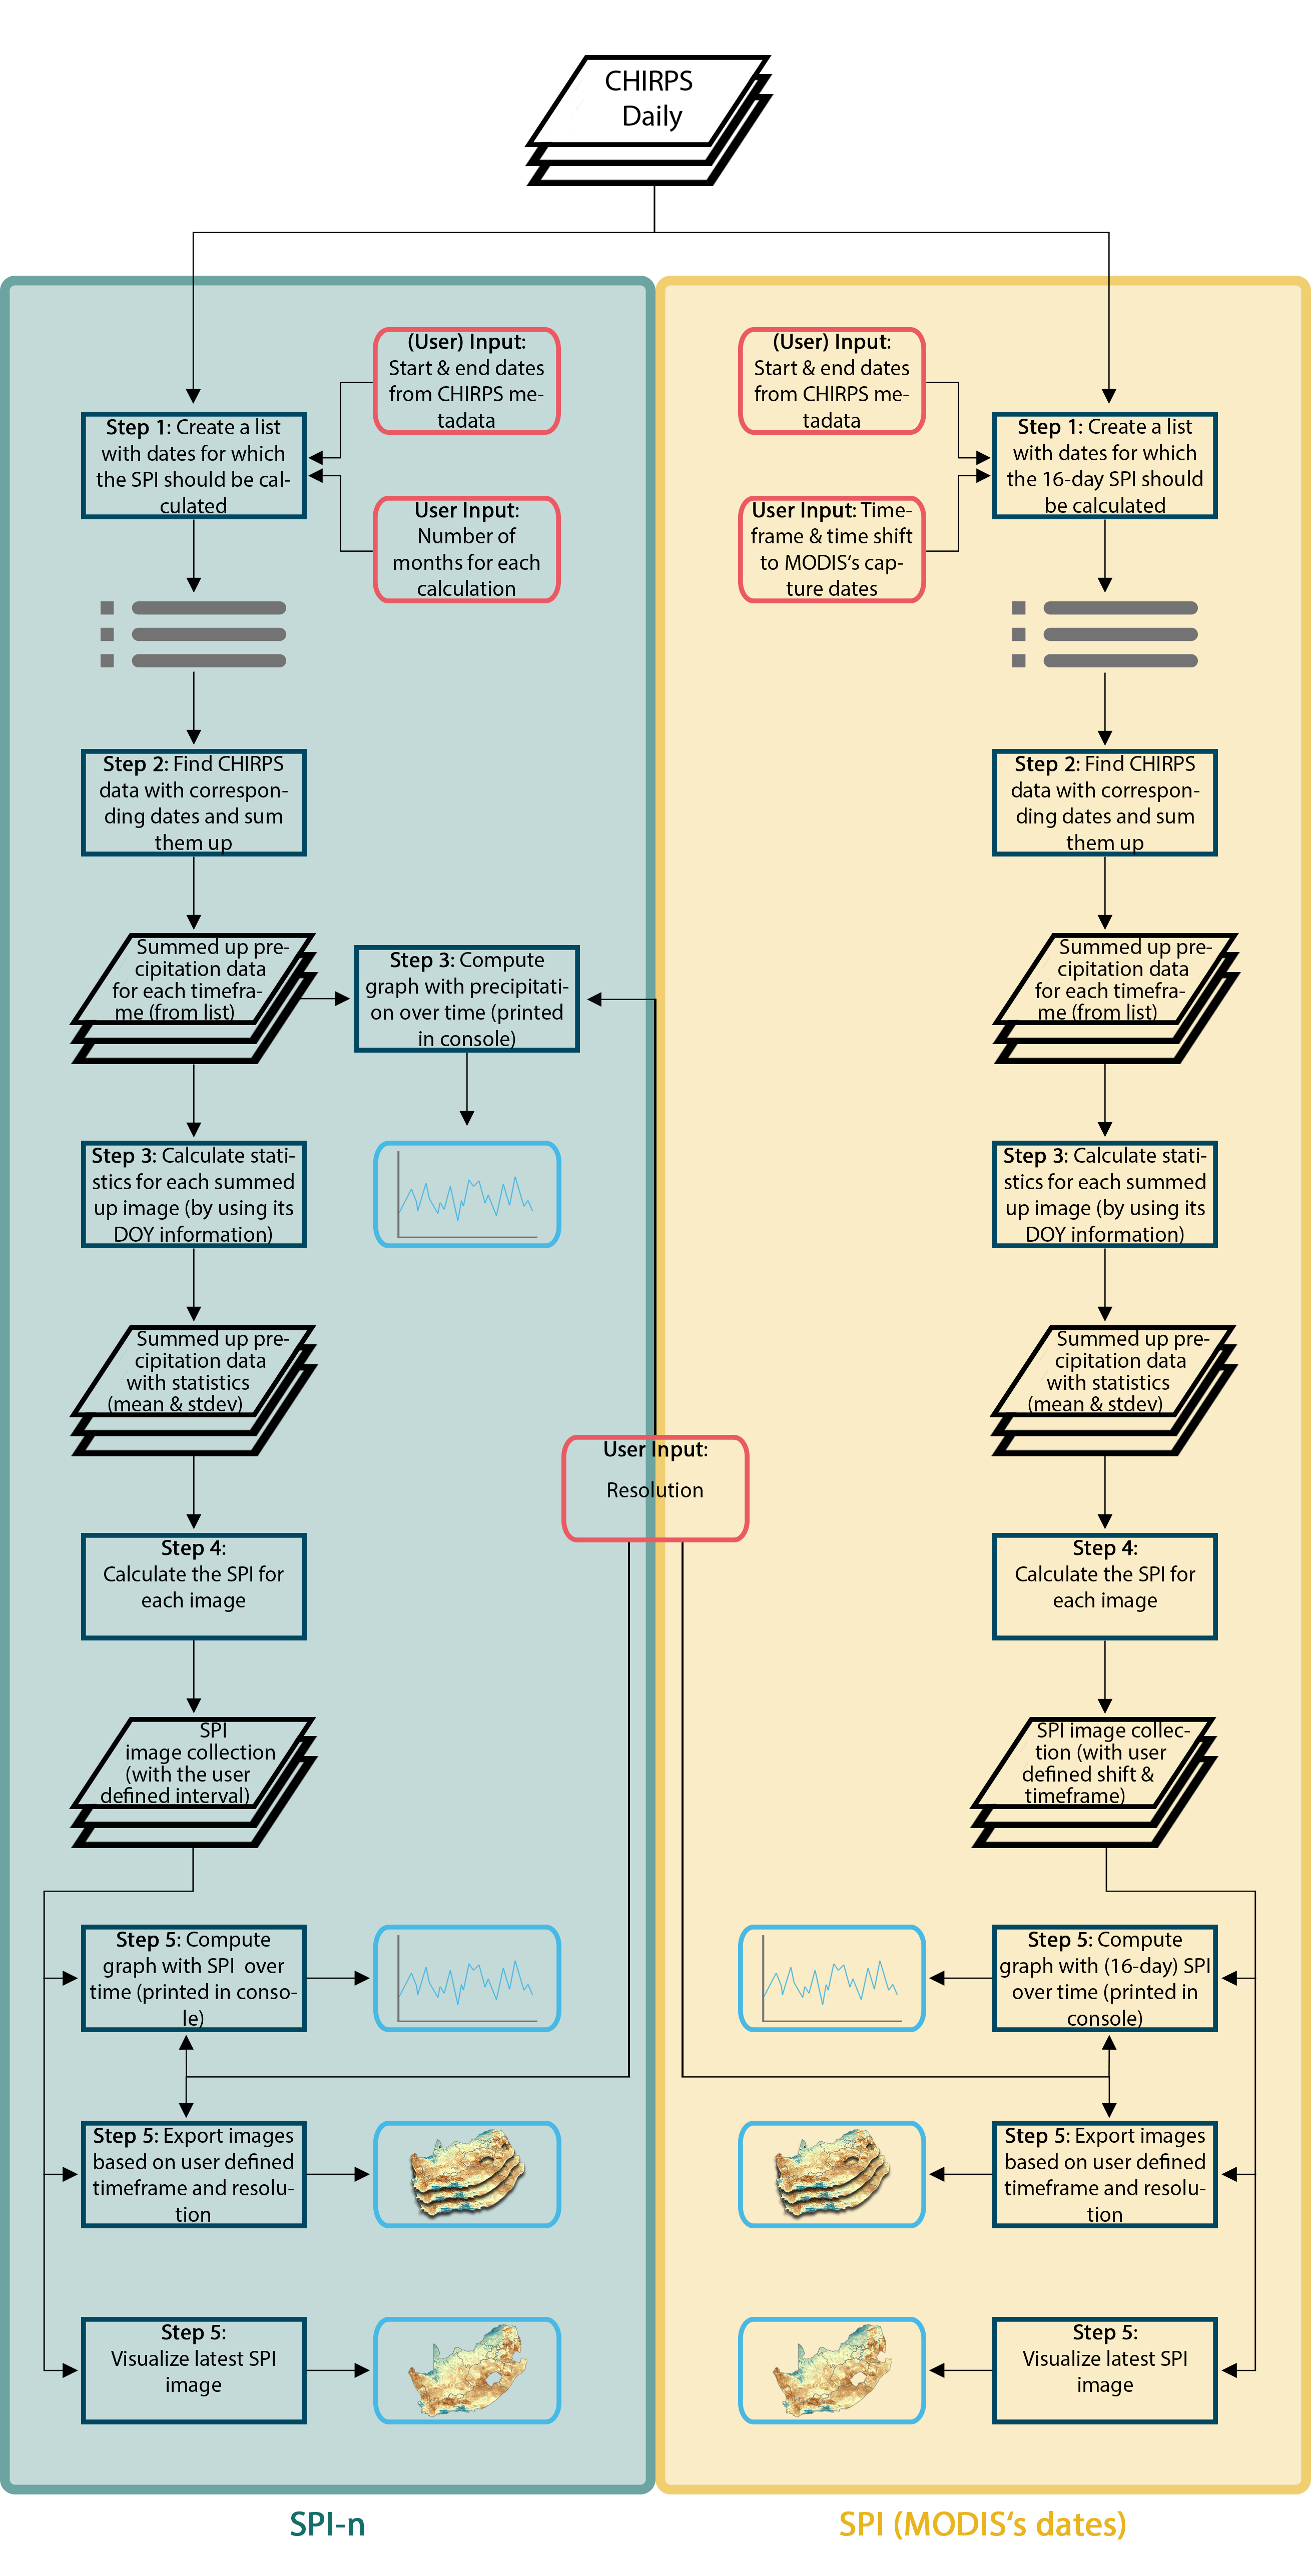
The SPI is a z-score deviation from the mean in units of the standard deviation, calculated from the CHIRPS precipitation values for each pixel location of a composite period for each year during a given reference period. The equation below shows the general calculation of the SPI.
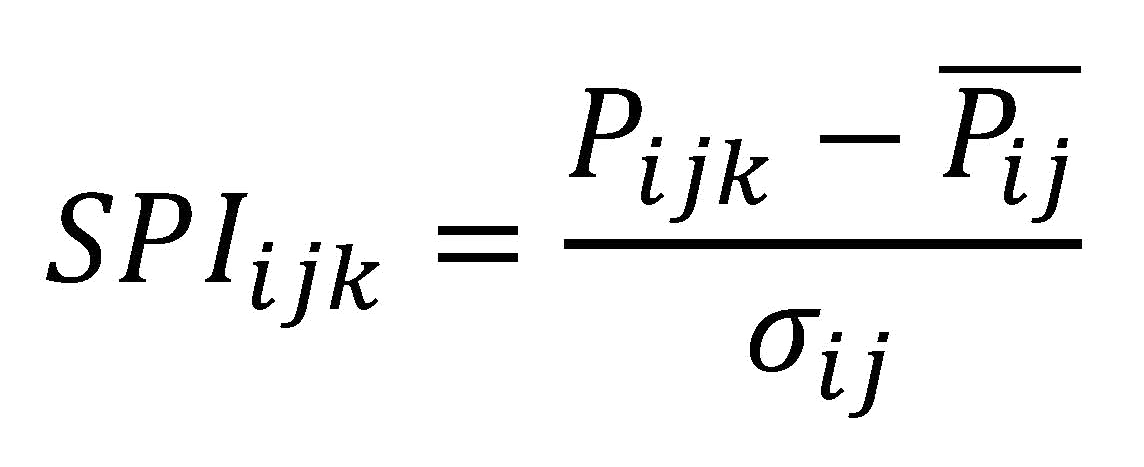
where SPIijk is the z-value for the pixel i during timeframe j for year k, Pijk is the precipitation value for pixel i during timeframe j for year k, Pij is the mean for pixel i during timeframe j over n years, and σij is the standard deviation of pixel i during week j over n years.
As precipitation data is usually not normally distributed, especially when it comes to timeframes of 12 months or less, a transformation should be applied. The data is typically fitted to a gamma function.