Australia

country taxonomy block

When analysing wildfires and their impacts, remote sensing instruments provide frequent, broad coverage at minimal incremental cost and at no risk, compared with traditional in situ monitoring. Over the past 20 years, the research community has developed tools and techniques to capture key aspects of fire behavior and impacts, with data from spaceborne instruments such as the Multiangle Imaging Spectroradiometer (MISR).

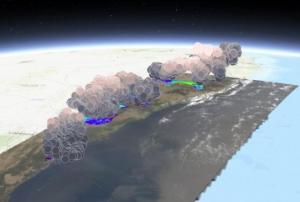
The NASA Disasters Program, in cooperation with the Active Aerosol Plume-height (AAP) project, has developed the first-ever interactive 3D map of MISR fire plume-height data, which demonstrates the height of smoke plumes emanating from the Australian fires. The 3D data was captured by NASA’s Terra satellite which flew over the eastern coast of Australia on 16 December 2019. The map shows that in…

more
Publishing date 03/02/2020

The Australian Flammability Monitoring System is a new vegetation condition and flammability online mapping tool that is expected to support fire and land managers in Australia.

The mapping tool uses satellite data to collect information on moisture content in highly flammable vegetation such as fallen bark, leaf litter and grass. It then displays this information on an interactive map, which will help fire managers in determining burning efforts and preparing of firefighting resources.

A team of researchers from the Australian National University (ANU) developed the monitoring tool - the first web-based system of its kind in Australia - as part of the Mapping bushfire hazards and impacts research project with the Bushfire and Natural Hazards CRC.

more
Publishing date 20/09/2018
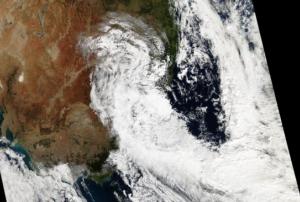
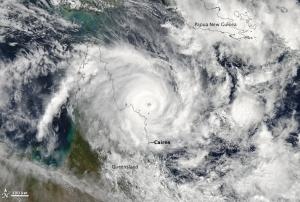
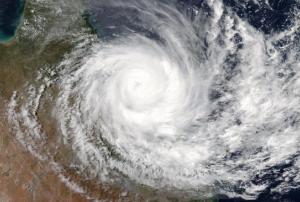
A powerful cyclone has hit the north-eastern coast of Australia. It made landfall in Queensland on 28 March 2017. With winds up to 263km/h, it was first assessed as a category 4 storm, and then it was downgraded to category 2 when moving inland. On 29 March, the authorities warned that a 1,300 kilometer stretch of the north-eastern coast is at dangerous risk of flooding. The International Charter was activated on 29 March 2017 by Geoscience Australia on behalf of the Emergency Management Australia. According to the BBC, more than 25,000 people were urged to evacuate their homes. Authorities say they will be able to assess the extent of damages in the upcoming days. 
To see the data sources and other information used in case of severe storms emergency response, see our Space Application Matrix in the “Space Application” section.
more
Publishing date 30/03/2017

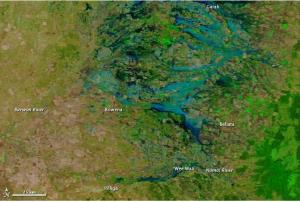
On 26 September 2016 the International Charter Space and Major Disasters was activated due to floods in Australia. The request for activation was due to heavy rainfall throughout the month of September causing flash flooding along the Lachlan River in Australia.

The flooding at Forbes is one of the worst over the last twenty years in this area and is expected to worsen over the next week as more rain is forecast.

The activation of the Charter was requested by Geoscience Australia, which has also been nominated as Project Manager. 

According to ABC News Australia, the State Emergency Service in New South Wales has received more than 2300 requests for assistance from people in low-lying areas. More information from ABC News Australia is available here.

Publishing date 05/10/2016

Geoscience Australia is working on a real-time satellite system for bushfire monitoring that would send images to emergency services and the Australian public every 10 minutes, a spectacular increase in frequency as these captures are currently available every six hours. The programme, called “Sentinel”, is part of the National Emergency Management Projects (NEMP), funded by the Federal Government, and it should be launched by mid-2016.

The imagery will be captured by Himawari-8, a weather satellite operated by the Japan Meteorological Agency, launched in October 2014. It features a 16 channel multispectral imager to capture visible light and infrared images of the Asia-Pacific region. The data will be sent directly to firefighters via a live web feed, and another public facing web service will also be established.

Dr Chris Pigram, director of Geoscience Australia, stated that "the system will be able to measure hotspots from four…

more
Publishing date 12/08/2015

Insurance Australia Group (IAG) launched a new natural disaster management instrument at the Global Insurance Forum in New York, the Global Risk Map. This interactive map shows the social and economic impact of cyclones, floods, earthquakes and related disasters during the past 115 years.

It focuses on areas that are most susceptible to be affected by disasters, taking into account their social conditions and resilience as well as insurance information, which is the biggest novelty according to IAG. This map is included in the IAG-led Global Resilience Project, a three-step commitment to the UN Principles of Sustainable Insurance (PSI).

According to Leona Murphy, IAG’s chief strategy officer, this interactive tool will help in to mitigate disaster owing to its in-depth study of vulnerable areas and “by forming a strategic global partnership under the PSI, insurers and reinsurers across the globe can continue…

more
Publishing date 25/06/2015

An agreement has been signed between the Australian CSIRO research institute and the European Space Agency (ESA) which will allow Australia to get access to European satellite data, while ESA would benefit from Australia’s research expertise during joint projects on space technology and applications.

ESA and Australia have been collaborating on Earth observation for many years, including the development of tools, calibration and validation activities and data exploitation connected to the ERS and Envisat missions. Moreover, ESA owns a facility in Western Australia to track space missions.

Volker Liebig, ESA’a Earth Observation Programme Director stated that ESA welcomes this increased cooperation with Australia: “ It will strengthen scientific links and stimulate industrial opportunities”. Dr. David Williams, CSIRO’s Executive Director of National Facilities and Collection argued that “the collaboration with the European Space Agency…

more
Publishing date 18/06/2015

A recent satellite-based study published in Nature Climate Change shows the world is becoming greener despite the high deforestation of some regions.

The researchers have found that a new growth in the drier savannas and shrublands of Africa and Australia, together with recovered forests outside the tropics, is helping to balance the ongoing deforestation in areas such as South America and Southeast Asia.

The research has been developed using a new technique called “passive microwave remote sensing”. It allows to map changes in vegetation biomass using satellite measurements of changes in the radio-frequency radiation emitted from the Earth’s surface, as the authors explained in The Conversation.

The information collected from satellites has been…

more
Publishing date 01/04/2015

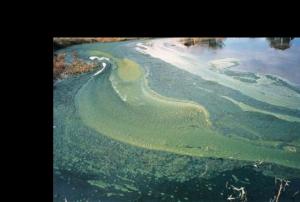
A new satellite-based early detection project for blue-green algae identification was initiated in Australia.

This new algae detection scheme, valued at $1.3 million, will be developed over a period of two years and results from the cooperative effort between the New South Wales government and the Commonwealth Science and Industrial Research Organisation (CSIRO). The program will use optical remote sensing techniques to identify algal blooms with the primary goal of decreasing the harmful impact of blooms on human health, the environment and regional economies.

The added value of the project is the capacity to deliver timely satellite information for algae detection in a faster way than the current methods available. According to the CSIRO, the new system will provide real time warnings with a range of remote sensors - such as satellites, planes, boats, bridges and buoys - and for different water sources.

Publishing date 04/11/2014

When using Space technologies for disaster risk management and emergency response, it is not only important to have access to the right data and software, it is also crucial to be aware of methods that have proven to be good practices in a certain context.

UN-SPIDER's Regional Support Offices and other partners are currently working on the development of Recommended Practices on the use of space technologies for various hazards. The aim is to describe successful methods that our partners have used and refined during the work in their regions in order to make these practices available to a global audience. The practices include a descriptive part and hands-on, step-by-step instructions on how to use satellite information for various hazards, in various phases of the disaster management cycle.

While these Recommended…

more
Publishing date 01/09/2014

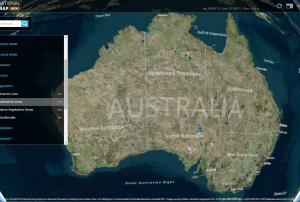
The federal government of Australia has launched the National Map, an online platform visualizing a number of the data sets released by the government.

This online map of Australia allows users to overlay geospatial datasets. It is a collaborative effort between the Department of Communications, National ICT Australia (NICTA) and Geoscience Australia, and includes data sets released by the government under the open data policy, including from the Australian Bureau of Statistics data, Bureau of Meteorology data, and data sets from data.gov.au. The datasets include terrain, vegetation, utilities, infrastructure, water, habitation and boundaries and data broadband quality and availability.

A range of open source software and frameworks has been used for the map, including Cesium, Leaflet, Geoserver, jquery, URI.js, proj4js, html2canvas, knockout, esri-leaflet.js…

more
Publishing date 10/07/2014

International Charter: Space and Major Disasters was activated on 11 April. Geoscience Australia requested the activation because of the expected Cyclone Ita. 

The Cyclone caused flooding in the Solomon Islands, as UN-SPIDER reported, on its way to Australia. The forecast was for it to bring powerful winds and heavy rain also to the Australian coast. More than 30,000 residents of the Coast cities have been evacuate in advance.

As the Storm hit the coast, it was moving with winds at roughly 140 km/h, causing a lot of damages that are still to be assessed. At its strongest, the Cyclone winds reached 232 km\h, category 4 out of 5 possible.

Publishing date 16/04/2014

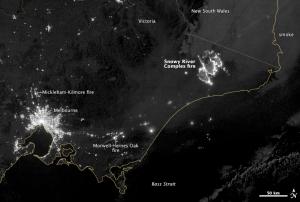
The summer heat in Australia brought high temperatures as well as strong winds to an already dry environment and created conditions for big fires. By yesterday almost 200,000 hectares had burned. The massive Snowy River Complex fire alone lights up an area of the size of Melbourne.

The Suomi NPP satellite Visible Infrared Imaging Radiometer Suite (VIIRS) took images of three fires – the Snowy River Complex fire, the Mickleham-Kilmore fire, and the Morwell Hernes Oak fire. The three are producing great amounts of smoke that spreads all the way to New Zealand and is even visible in the night photos.

Although the Snowy Rover Complex fire had spread over great area it does not pose any threat to infrastructure or urban areas due to its remote location. The other two fires are dangerous in many ways. The Morwell-Hernes Oak fire is burning in an industrial region, close to an open coal mine. It threatened four urban communities, but the authorities had it under control…

more
Publishing date 13/02/2014

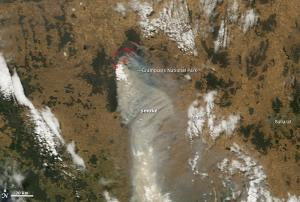
This image of intense bushfires in and around Grampians National Park in western Victoria, Australia, was captured from Space on 17 January by the Moderate Resolution Imaging Spectroradiometer (MODIS) on NASA’s Terra satellite.

Australia has been suffering a great heat wave for the last couple of weeks which caused wildfires in several states. The fires burned 43,000 hectares in the Grampians National Park in western Australia.

more
Publishing date 22/01/2014

New South Wales State Emergency Services (NSW SES) launched a new mapping system to help emergency responders coordinate better rescue operations. It allows volunteers on the ground to instantly share real-time information.

The system was first used in 2013 during floods when 20,000 people were isolated. According to NSW State Emergency Service GIS Manager Elliot Simmons the maps were used successfully on site and the project is now extended to 229 units throughout the State.

With previous systems, emergency responders had to be online and connected to the NSW SES network to receive geospatial data. The new mapping system enables them to share information about infrastructure and evacuation on the ground in real time.

With this information available, the authorities will make more informed decisions in shorter time which will improve the response time and people’s safety.

Publishing date 09/01/2014

While recreating a 7.1 level earthquake, Queensland Fire and Rescue Service (QFRS) members demonstrated the potential of Geographic Information System (GIS) technology in emergency response, by using a technology called Rapid Damage Assessment system. The system helps emergency responders to instantly map and assess damages, and therefore tackle crucial questions, such as where to deploy rescue workers or how to prioritize responses, in case the disaster were to occur.The simulation of the earthquake was part of an event held to help international experts share large-scale natural disaster response strategies in Switzerland with teams from more than dozen different nations. In the course of the event, a 7.1 level earthquake was recreated that destroyed the Swiss town of Basel in 1356.

“In real life, GIS technology enables our authorities to instantly share critical geographic information about natural disaster damage,” QFRS Executive Manager of Operational Capability Stephen…

more
Publishing date 26/08/2013

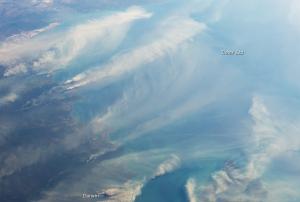
Smoke plumes from fires, volcanoes, and pollution are all reaching high into the atmosphere and can therefore very easily be detected from space. Most recently, Astronaut Karen Nyberg shot a photograph of fires around Darwin and Melville Island, Australia, on August 5, 2013, while looking west across the Timor Sea from the International Space Station (ISS). She also took a photo looking straight down on the fires.

According to Australian fire researcher Peter Jacklyn, fire researchers mostly rely on nadir, or straight-down, satellite views of fires because the images can be overlaid on traditional maps for the sake of studying hot spots and burn scars. But oblique views like the photo from Nyberg can be useful for studying plume structures. They are also incredibly useful, Jacklyn notes, for “communicating to people the impact and prevalence of fires.”

During the month of August 2013,…

more
Publishing date 22/08/2013

The University of Melbourne, IBM (NYSE: IBM) and NICTA today jointly announced that they are collaborating to develop the Australia Disaster Management Platform (ADMP), a next generation open standards-based IT platform aimed at improving disaster management, protecting communities and potentially saving lives.

Over the past decade alone, the world has experienced a deluge of natural and man-made disasters impacting millions and costing trillions of dollars in property and infrastructure damage. In response, researchers from the Melbourne School of Engineering at the University of Melbourne, IBM and NICTA will develop and implement an innovative, integrated, open standards-based disaster management platform designed to gather, integrate and analyse vast amounts of geo-spatial and infrastructure information from multiple data sets to create real-time practical information streams on disaster events. As well as enabling real-time situational awareness, the information…

more
Publishing date 16/03/2013

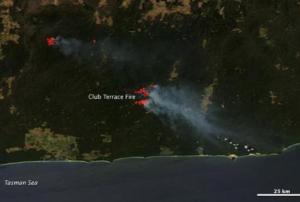
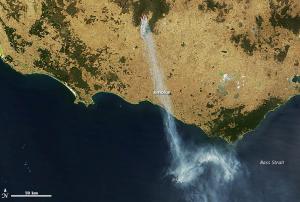
The Moderate Resolution Imaging Spectroradiometer (MODIS) on NASA’s Terra satellite captured this image showing large bush fires burning in southwestern Victoria on February 18, 2013. Red outlines indicate hot spots where MODIS detected unusually warm surface temperatures associated with fires. Winds blew a long plume of smoke south toward the Bass Strait.

About 300 firefighters using dozens of vehicles and 14 aircraft were battling the fires, which were burning near Grampians National Park. Lightning ignited a number of fires about a week ago; two of them merged to create the large fire shown here. Authorities estimated that it had burned about 6,000 hectares (15,000 acres) by Feb. 19.

more
Publishing date 22/02/2013

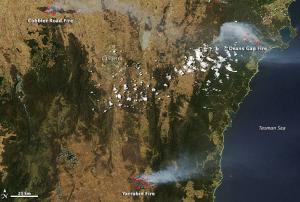
The Moderate Resolution Imaging Spectroradiometer (MODIS) on NASA’s Aqua satellite captured an image showing the large bush fires burning in eastern New South Wales, Australia, on 9 January 2013. Red outlines indicate hot spots where MODIS detected unusually warm surface temperatures associated with fires.

Temperatures cooled somewhat in New South Wales on January 9, 2013, a day after record-breaking temperatures seared Australia’s most populous state on back-to-back days. Despite the reprieve, bush fires continued to rage throughout New South Wales and many other parts of the continent.

Extreme heat and strong winds have fueled the fires. Statistics released by Australia’s Bureau of Meteorology indicated that the average temperature across the country on Tuesday, 40°Celsius (104°Fahrenheit), was the highest ever recorded, exceeding a mark set just the day before. Australian meteorologists were even forced to add extra color bands to their…

more
Publishing date 10/01/2013

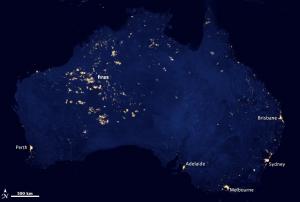
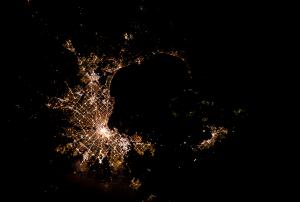
A new map of the Earth at night that NASA published two weeks ago showed the footprint of human civilization on the planet, as revealed by the lights we use to brighten the darkness. The map was built by Earth Observatory designers together with colleagues at the National Geophysical Data Center and made possible by a new NASA and the National Oceanic and Atmospheric Administration (NOAA) satellite. But it turns out the map showed something more. Astute readers noticed lights in areas that were thought to be uninhabited. Many of those readers pointed to Western Australia and asked: How can there be so much light there?

The top image above shows the night lights of Australia as observed by the Visible Infrared Imaging Radiometer Suite (VIIRS) on the Suomi NPP satellite in April and October 2012. The composite image includes manmade light sources and the light of wildfires. The data were acquired over nine days in April 2012 and thirteen days in October 2012, and it took the…

more
Publishing date 20/12/2012

Australia became an international collaborator on the new US-satellite mission Landsat 8, under an agreement signed on 12 July 2012 with the United States Geological Survey. Landsat 8, the latest in the series of Landsat satellites, is expected to launch in January 2013. It will continue almost forty years of operation of the Landsat series of land observing satellites, part of the Landsat Data Continuity Mission, which is the longest continuous record of the Earth’s surface as seen from space. “This agreement is vital to ensuring the nation’s future satellite imagery requirements are met, and confirms Australia’s commitment to working with the United States to deliver civilian uses of space,” the Minister for Resources and Energy, Martin Ferguson, said. “When launched, the satellite will provide Australia with immediate and direct access to the highest quality satellite data, replacing its current reliance on the ageing Landsat 5 and 7 satellites.”

The Landsat series of…

more
Publishing date 16/07/2012

The insurance industry is recognising GIS as a powerful tool that will drive comprehensive business transformation.

An international geospatial expert Simon Thompson has been meeting Australia’s top insurers as the industry faces widespread reform following two years of severe flooding that has inundated large parts of the country and exposed extensive underinsurance and poor risk assessment processes.

"Layering detailed flood and engineering models over residential or commercial property data enables insurers to more accurately and efficiently understand their portfolios and deliver better products and services to their customers."

Mr Thompson said the spatial industry has traditionally been more focused on technology instead of information sharing, but this is now changing.

more
Publishing date 26/03/2012

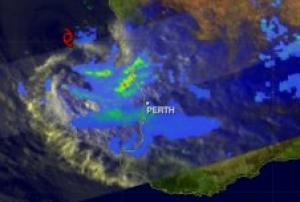
Tropical Cyclone Iggy is now a memory in southwestern Australia but it made its presence known when it made landfall on Australia's Sunset coast on February 2, 2012. NASA's TRMM satellite provided measurements of rainfall rates as it headed toward landfall and noticed heavy rain was falling in some coastal areas. Sunset Coast is the section of the coastline in Western Australia that encompasses the northern area of Perth, according to the Tourism Western Australia. Perth is the capital city of Western Australia.

On February 2, 2012 at 1044 UTC (5:44 a.m. EST) the Tropical Rainfall Measuring Mission (TRMM) satellite saw weakening Tropical Storm Iggy as it was approaching the coast of southwestern Australia. An image of rainfall rates was created at NASA's Goddard Space Flight Center in Greenbelt, Md. NASA co-manages TRMM with the Japanese Space Agency. The image was created using data from both TRMM's Microwave Imager (TMI) and Precipitation Radar (PR) instruments. The image…

more
Publishing date 06/02/2012

Water minister Peter Walsh said the $12.1 million Floodzoom tool will be built to improve communications to communities that are situated in areas that flood.

“It will give emergency services a more accurate prediction of flood behaviour and help individual land holders assess their own flood risk,” the minister said.

Floodzoom will be built to use weather forecast models, satellite observations, river gauges and hydrological modelling to improve warnings and emergency response.

“Emergency services organisations will be able to use the information to plan response activities before a flooding,” Mr Walsh said.

“[It will also] provide the community with information so they can act to reduce their risk”.

According to a DSE spokesperson said the project will involve a web based, computer generated flood intelligence platform that will “simulate and depict flood behaviour in…

more
Publishing date 04/05/2011