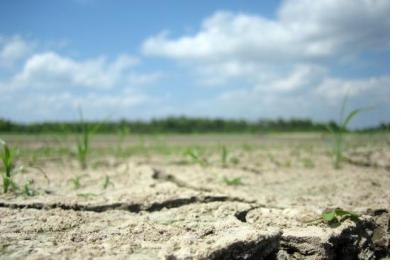
Large parts of Southern Europe have suffered from drought this summer as a result of ruthless heat and low rainfall. A new near-real-time soil moisture data set developed as part of the European Space Agency’s (ESA) Climate Change Initiative (CCI) uses space-derived information to support drought monitoring efforts.
“Lucifer”, as this year’s heatwave across Southern Europe is nicknamed, has gripped Southern European countries from the Balkans to Portgual. In Italy, such a sustained period of extreme temperatures has not been seen since 2003. In several parts of the country, rainfall levels in the first six months of 2017 were 80% below average, leading to conditions as during the droughts of 2007 and 2012.
Vegetation conditions and soil moisture indicate occurrences of drought
Space-derived information plays a key role in monitoring drought, alongside in-situ observations, which traditionally have been based on rainfall data and the Standard Precipitation Index (SPI). Some of the indicators using space data, such as the Normalized Difference Vegetation Index (NDVI) and the Standard Vegetation Index (SVI), use the condition of the vegetation as a proxy for drought. Vegetation growth is limited by water in most areas. As a result, the relative density of vegetation is seen as an suitable indicator of agricultural drought. In the case of the NDVI, researchers will compare the value of the month of any given year to the average value for that month over longer periods of time. A current value below the average value over longer periods of time is considered an NDVI anomaly indicative of drought. UN-SPIDER has produced step-by-step guides on how to map drought using the VCI and SVI indicators, which can be accessed online.
Soil moisture in another surface characteristic that is used as an indicator for drought. It is commonly used to track agricultural droughts, which occurs when there is insufficient soil moisture for crops, for instance as a result of less than average precipitation. Also, when the ground is wet, water evaporates as the day warms up, resulting in afternoon showers when it meets the colder air above the Earth’s surface. The water remains in the ground through the cool night, and the cycle repeats the next day. When soils are drier than normal, less moisture is transferred to the atmosphere.
New global data set updated every 10 days
A new near-real-time soil moisture data set from the European Space Agency’s Soil Moisture Climate Change Initiative (CCI) project aims to improve forecasting and monitoring of droughts. The data set is based on satellite measurements of active and passive microwaves, the intensity of which depends on the amount of water in the soil. The data set, which provides global coverage for the period from 1978 to present, has been developed by the Vienna University of Technology (TU Wien) and the Dutch company VanderSat B.V., two of the partners of ESA’s Soil Moisture CCI. It is updated every 10 days by the Earth Observation Data Centre (EODC) in Vienna.
The data set is already used by Italy’s Research Institute for Geo-Hydrological Protection of the National Research Council (IRPI-CNR), which also contributed to its development, to closely monitor conditions in the country. Using the data, researchers from the institute were able to see that soils, especially in central Italy, were much drier than usual at the end of July. IRPI-CNR will use the data set to improve flood and landslide forecasts as well as global rainfall estimations through their SM2RAIN system.
The data can already be explored visually through TU Wien’s data viewer and will be officially accessible in January 2018 through the European Centre for Medium-Range Weather Forecasts, which operates the Copernicus Climate Service.

