This Recommended Practice requires the use of commercial product from Airbus Defence Systems.
The procedure makes use of the free and open Quantum GIS (QGIS) desktop software.
1.Load data in QGIS
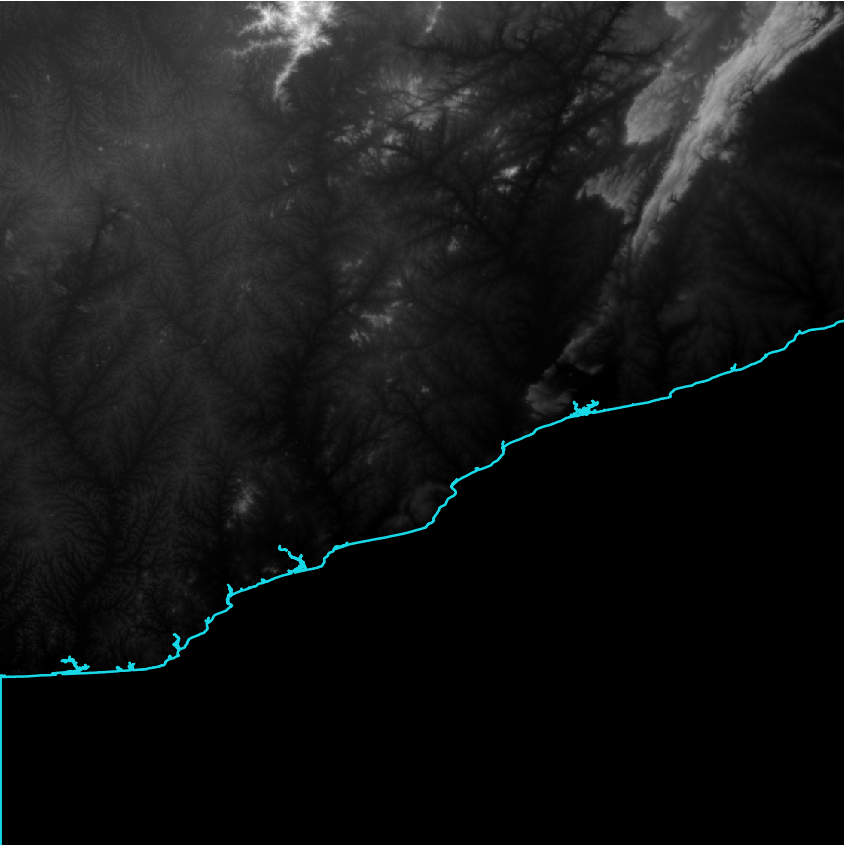
First all data relevant for coastal flood modelling has to be loaded in QGIS: The Digital Elevation Model raster file and the Ocean extent vector file. Figure 1 shows an example of the coastal region in Accra Region in Ghana, where the WorldDEMTM elevation data and the ocean extent of the WorldDEMTM Ocean Shoreline have been used.
Figure 1: WorldDEMTM and WorldDEMTM Ocean Shoreline for N05W001, Accra region, Ghana
2.Raster calculation
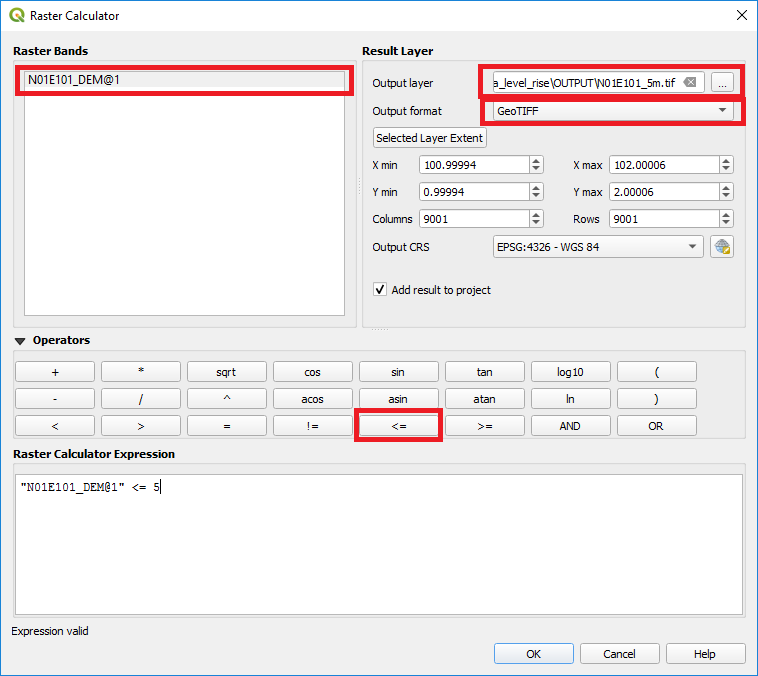
In the next step, all elevation pixels below a certain elevation threshold will be detected. Opening the Raster Calculator through Raster > Raster Calculator the window shown in Figure 2 will pop up.
First, select your DEM layer and click on the ‘less or equal’ math operator to create a Raster Calculator Expression. Then set the threshold for the flood level you would like to simulate. In this sample case a value of 5m has been set. Furthermore the Output layer as well as Output format has to be set.
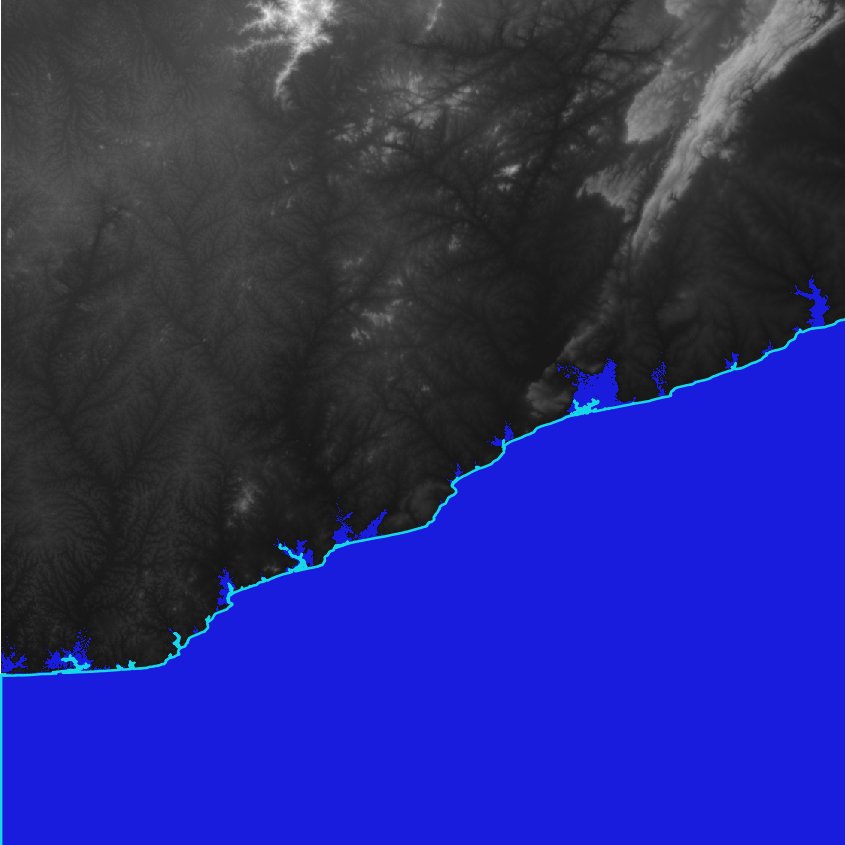
The result is a binary layer classifying all potential flooded areas by 1. An example is shown in Figure 3, where all pixels below or equal 5m are indicated in blue.
Figure 2: QGIS Raster Calculator
Figure 3: Potentially flooded areas (flood level of 5m) indicated by blue for N05W001, Accra region, Ghana
3. Define NoData value
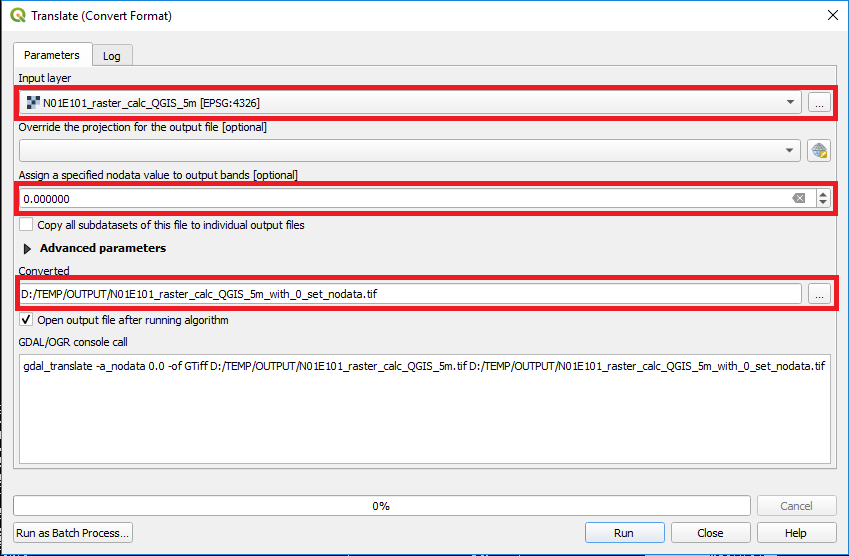
All dry areas in the classification mask are now set to NoData using the QGIS Translate tool. The tool is accessed via Raster > Conversion > Translate (Convert Format). Besides setting the Input layer (Classification from previous step) and Converted output file, the NoData value has to be assigned to 0.
Figure 4: QGIS Translate tool
4. Polygonize
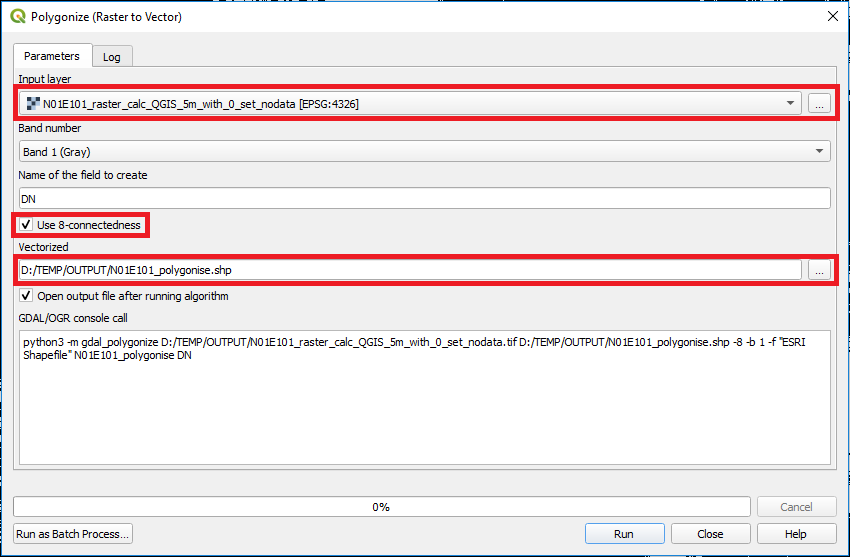
After defining the NoData value for the classification layer, the file is going to be converted to a vector file using the Polygonize tool. After opening the tool through Raster > Conversion > Polygonize (Raster to Vector) the input and output files have to be defined. In addition the user can decide if the 8-way-connectivity should be considered for the conversion.
Figure 5: QGIS Polygonize tool
5. Filter inland water patches
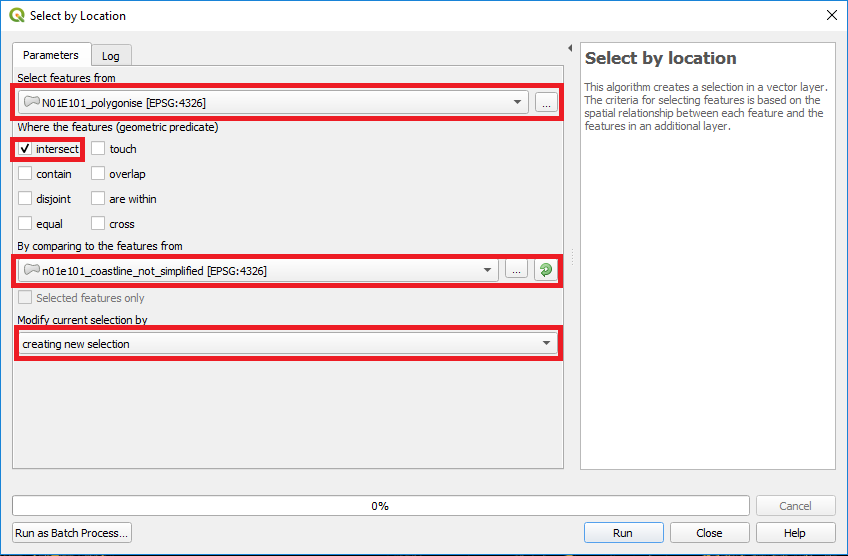
To filter inland water patches, which fulfill the elevation threshold but are not connected with the ocean, the Select by Location tool (Vector > Research Tools > Select by Location) in QGIS is applied (see Figure 6). Therefore the polygonized potential water extent has to be intersected with a coastline vector to filter inland patches. The features of the polygonized layer from the previous step have to be chosen as Select features from and will be compared with features from a costal vector file. The geometric predicate should be set to ‘intersect’ and a new selection should be created.
After the new selection has been created the polygons will be saved as a new water extent layer for the modelled flood height through a right-click on the polygonised layer (Export > Save Selected Features As), see Figure 7. Take care that the option Save only selected features is activated.
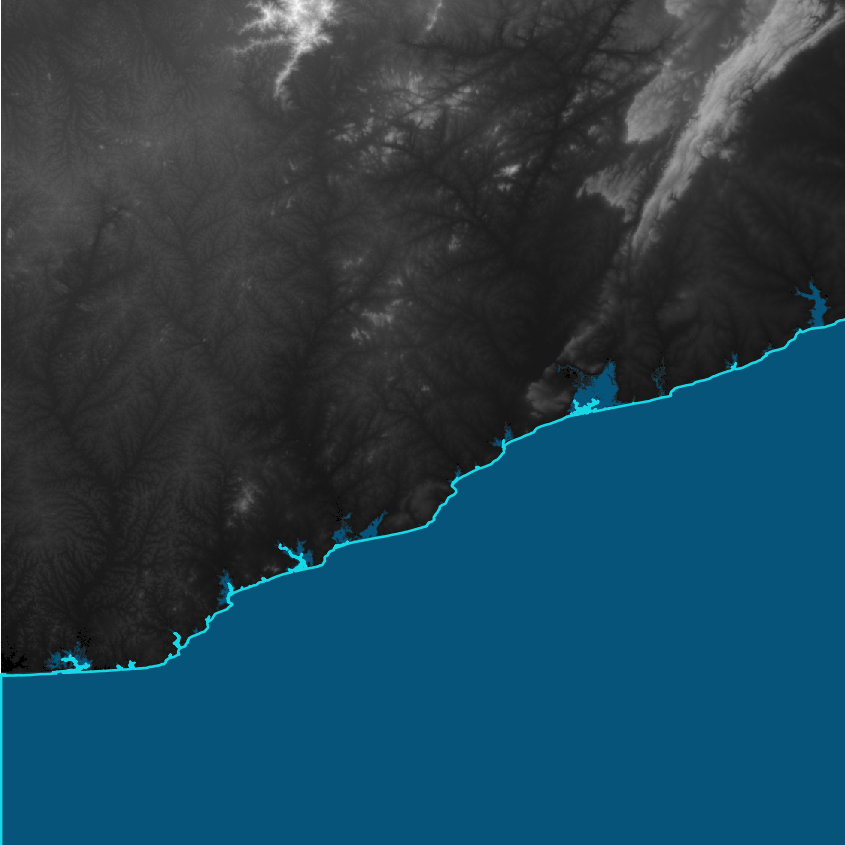
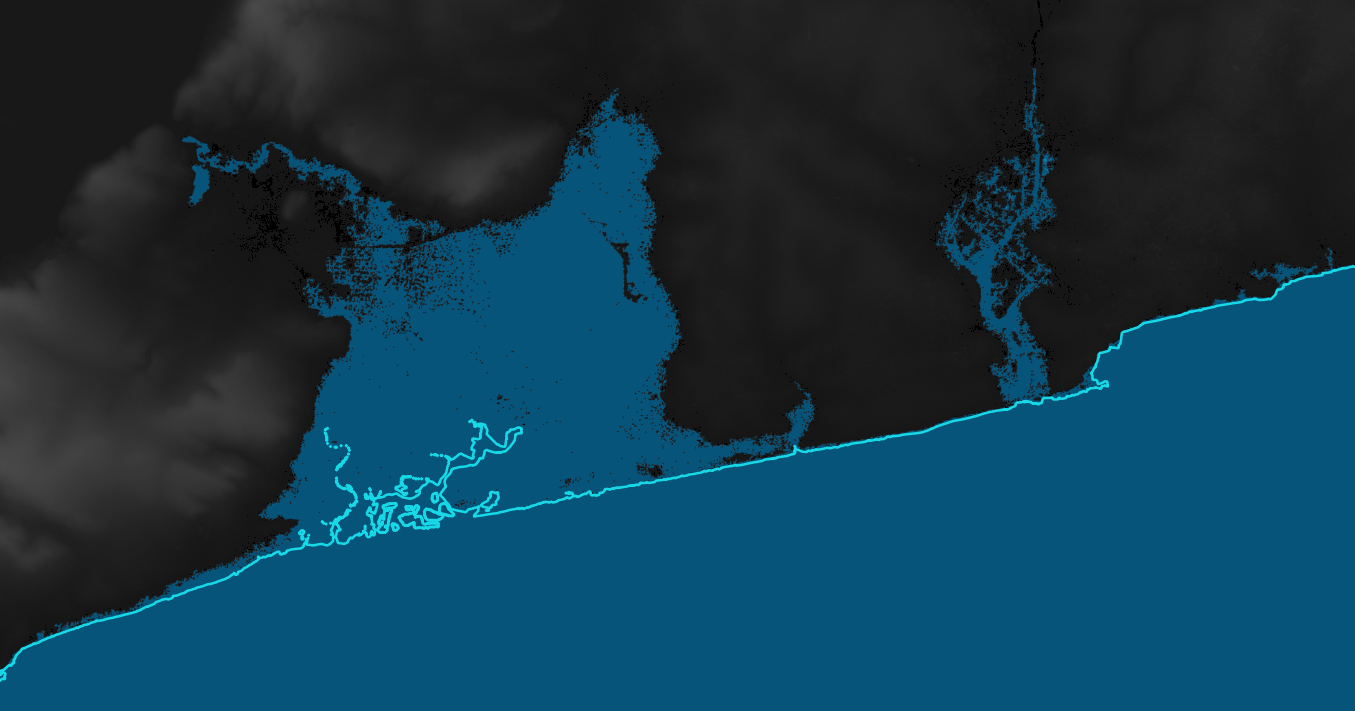
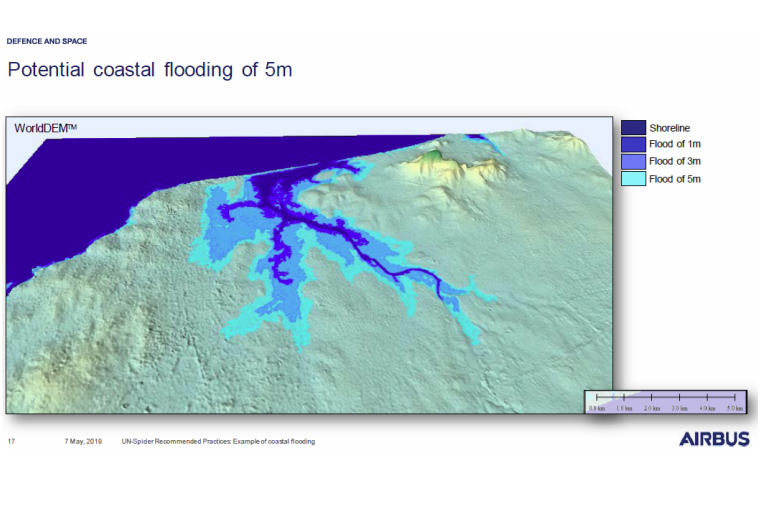
Figure 8 and 9 show the flooded areas in case of an event with a flood of 5m compared to the old ocean extent for the Accra region, Ghana.
Figure 6: QGIS Select by Location tool
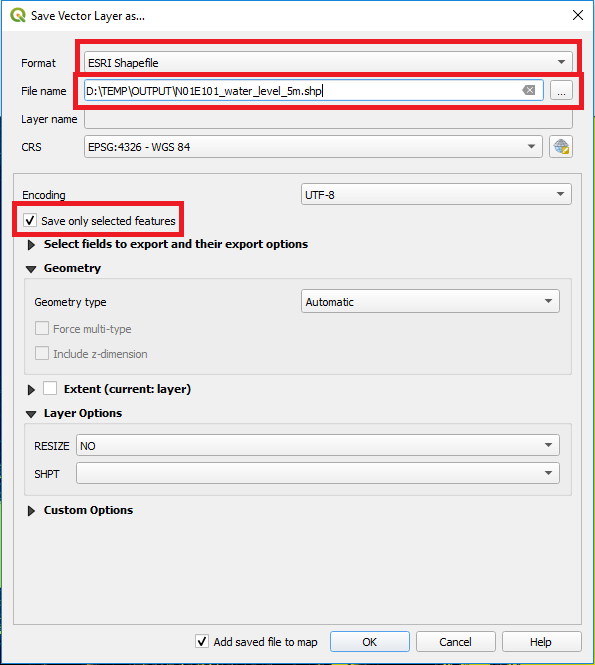
Figure 7: QGIS Saving of Vector Layer
Figure 8: Flooded regions in case of a flood level of 5m for N05W001, Accra region, Ghana
Figure 9: Zoom-In: Flooded regions in case of a flood level 5m for N05W001, Accra region, Ghana
