
In recent years, the world witnessed many devastating wildfires with disastrous impacts on the environment as well as on its population. In the past satellite- and airplane-based radar instruments have been used to detect wildfires and observe their temporal progression and the damage caused. A new scientific project supported by the Earth Applied Sciences Disasters programme at NASA uses radar data for a new approach in order to decipher where and how well landscapes recover in the years after major fires. This information is essential for forest and fire managers to manage future risks.
Radar instruments are vital for tracking fire fronts and burn scars during and shortly after fire has ravaged a landscape. They are very helpful as they are able to observe by day or night and can see land through clouds and smoke. Synthetic aperture radar (SAR) instruments, carried on the Sentinel-1 satellites, send out pulses of microwaves that bounce off the Earth’s surfaces. The reflected waves are detected and recorded by the instruments and can help map the shape of the land surface (topography) and the land cover — from cities to ice to forests. By comparing changes in the signals between two separate satellite or airplane overpasses, scientists can discern surface changes like land deformation after earthquakes, the extent of flooding, or the exposure of denuded or bare ground after large fires.
In the above-mentioned project supported by NASA, the scientist team uses Uninhabited Aerial Vehicle Synthetic Aperture Radar (UAVSAR) via research aircrafts. Deploying UAVSAR has various benefits, it has high resolution (5 m), is cloud-penetrating as well as smoke-penetrating and gives radar response related to moisture, roughness and the cm-scalestructure of the surface it is scanning. NASA research planes with UAVSAR mounted on their bottom flew over the same portions of Southern California several times since 2009. Therefore, a lot of data of this area have been collected and are available for further research. For seeing the long-term effects of fires in Southern California, the scientist team of Pinto and his colleagues at Jet Propulsion Laboratory Latha Baskaran, Yunling Lou, and David Schimel analyzed the radar data and developed a mapping technique to show the different stages of removal and regrowth of vegetation.
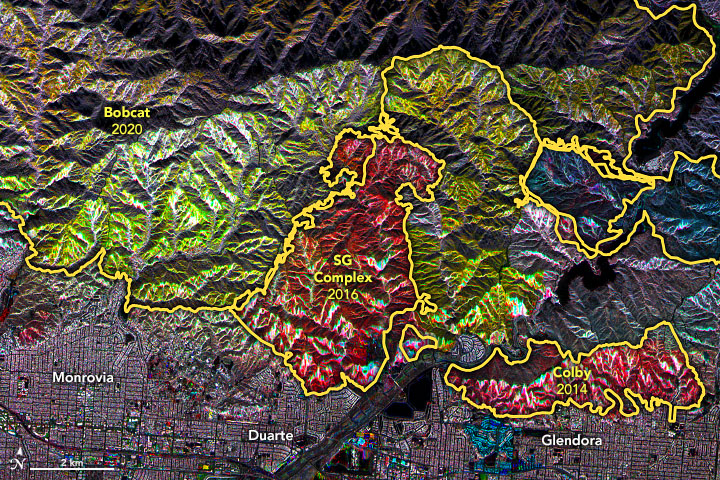
Mosaic Maps of Fire Data. Image: NASA
The map above is a compilation of radar data from observations across the last decade. The colors indicate the relative amount of vegetation observed by different UAVSAR flights at different times. Such precise information about the state of the vegetation is possible as radar signals bounce off burned, barren terrain differently than they reflect from unburned, brush-covered hillsides or from fresh growth. The different colors on the map show the stage of vegetation regrowth.
Vegetation is an important factor for the likelihood and magnitude of natural hazards like forest fires, therefore detailed information on the volume of vegetation and its changes is essential for disaster management. As the SAR technique can help to monitor forest regrowth and fire scar change over time and thus bring highly valuable information to forest and fire managers working to manage risks it is currently tested and validated.