Introduction
Land subsidence, a common and significant consequence of groundwater pumping, often occurs in densely populated areas underlain by unconsolidated geological basins, such as alluvial, lacustrine, or shallow marine deposits, particularly near seas, lagoons, or deltas. Initially unnoticed, subsidence often becomes evident only after severe damage has occurred, making remediation costly. However, growing awareness of its environmental and socio-economic impacts has lowered the alarm threshold, prompting modern resource development plans to include environmental impact assessments and predictive modeling of potential land settlement (Gambolati & Teatini, 2021).
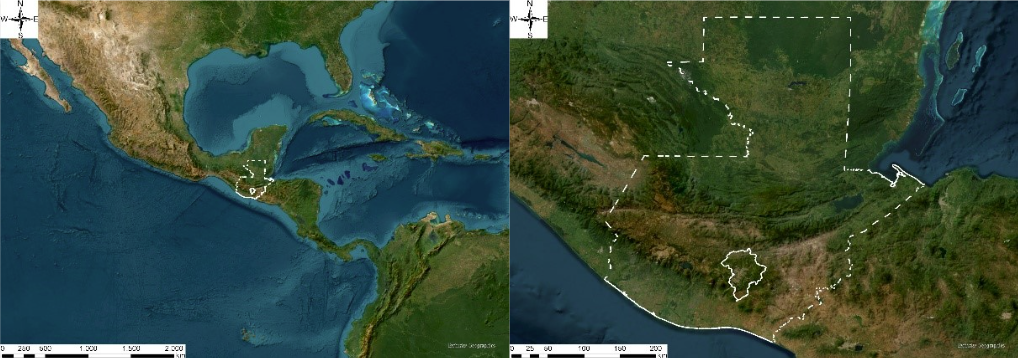
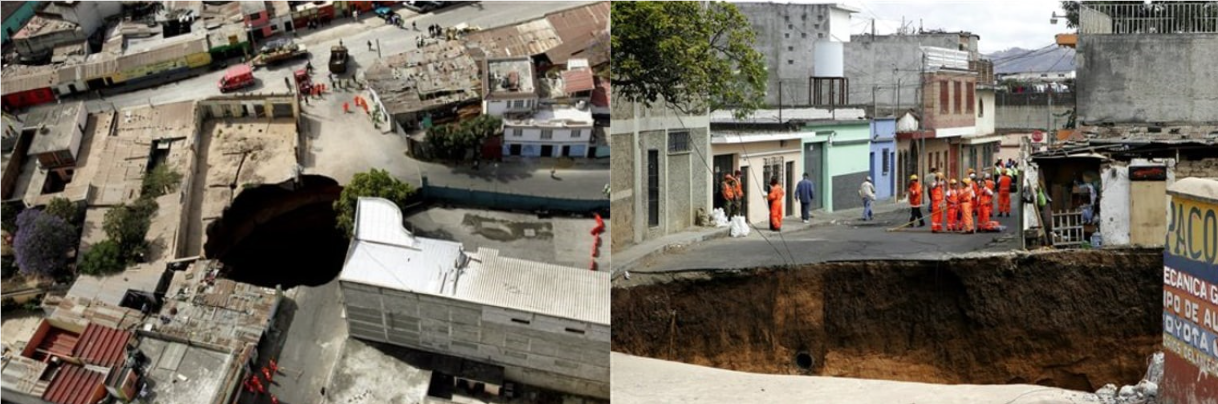
Guatemala is situated in Central America, just south of Mexico. Its capital, Guatemala City, is in the central-southern region of the country. The city has experienced significant geohazards in recent decades, including two major sinkhole events. In February 2007, a sinkhole measuring 30 meters in diameter and 60 meters in depth occurred in Zone 6, destroying five houses and claiming three lives. Another sinkhole occurred in March 2010, with a diameter of 18 meters and a depth of 36 meters, causing a three-story building to collapse and resulting in at least three missing people. Additionally, in October 2015, a landslide in Santa Catarina Pinula, southeast of Guatemala City, devastated buildings and led to significant loss of life (De León & Monterroso, 2016).
The geological structure of Guatemala City predominantly consists of volcanic rocks (Cunningham, 1984). The surface ground in the area where the 2007 sinkhole occurred is primarily composed of Quaternary volcanic sediments, such as ash and pumice, which are highly susceptible to erosion and breakage (Waltham, 2008). These sinkhole and landslide events are largely attributed to heavy rainfall and issues with the sewer system exacerbated by the area's weak geological composition.
Given the vulnerability of the ground in this region, this study focuses on detecting and analyzing significant land displacement signals to better understand and mitigate future risks.
Multi Temporal Interferometric SAR Analysis
Multi-temporal Interferometric Synthetic Aperture Radar (MT-InSAR) analysis is a powerful remote sensing technique used to monitor land subsidence and surface movements over time with high precision. It leverages SAR data acquired by satellites at different times over the same area and uses interferometric techniques to measure phase differences, which correspond to changes in the distance between the satellite and the Earth's surface (Kim, Kim, & Jung, 2019).
Data Collection: SAR satellites (e.g., Sentinel-1, TerraSAR-X) repeatedly image the same area over time. A stack of SAR images is acquired, often spanning months or years, to capture the temporal evolution of surface movements.
Interferogram Generation: Pairs of SAR images are processed to generate interferograms, representing the phase difference between the images. These phase differences can arise from surface deformations, atmospheric effects, and topographic variations.
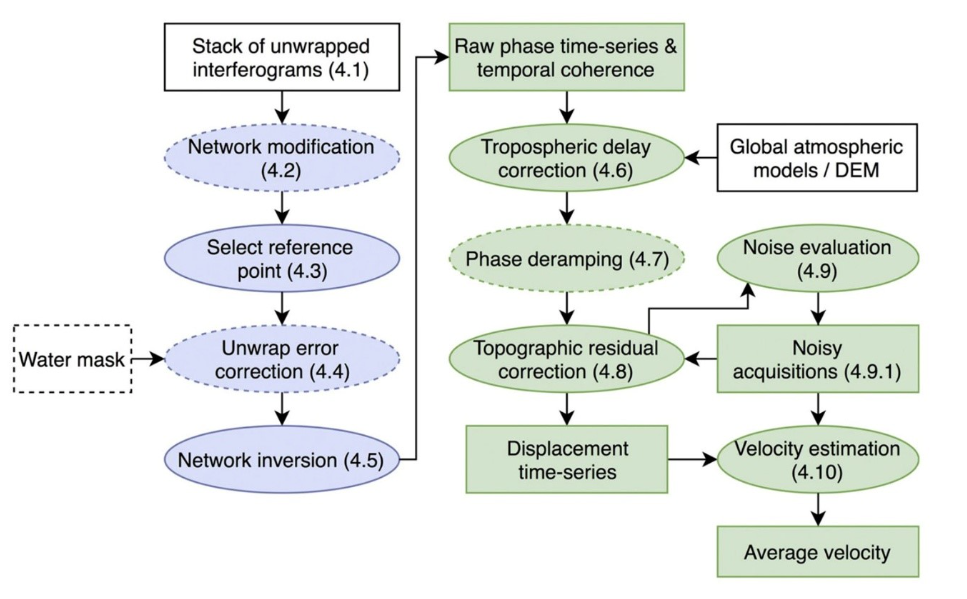
Multi-temporal Processing: Multiple interferograms from the SAR image stack are analyzed together to isolate deformation signals from other factors (e.g., atmospheric noise or orbit errors). Techniques like Persistent Scatterer Interferometry (PSI) and Small Baseline Subset (SBAS) are commonly used:
PSI focuses on stable reflectors (persistent scatterers) such as buildings or rocks.
SBAS uses interferograms with small temporal and spatial baselines, making it suitable for areas with decorrelation.
Deformation Time Series: The technique extracts a time series of ground displacement for individual pixels, allowing the analysis of surface motion trends, velocities, and patterns.
Geocoding and Validation: Results are geocoded to align with real-world coordinates. Ground truth measurements or ancillary data (e.g., GPS, leveling) validate the MT-InSAR results.
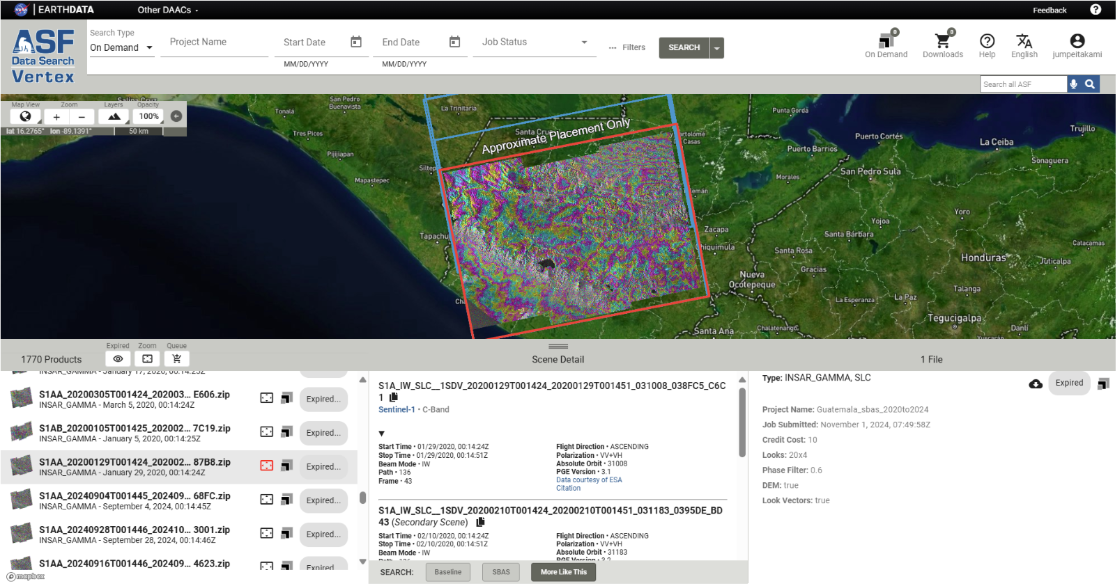
This study utilized C-band Sentinel-1 data collected between November 2014 and March 2018. By analyzing data from both ascending and descending orbital paths, relative movements were decomposed from the line-of-sight measurements of each path into vertical and horizontal components. The dataset is downloaded through the Alaska Satellite Facility (ASF) SAR Data Search Tool, which is an interface that allows users to search, visualize, and access SAR data (ASF Data Search).
Also, we used the MintPy software package (Yunjun et al., 2019) for SBAS time-series analysis of interferometric SAR data, leveraging its robust noise correction and phase unwrapping algorithms.
- MintPy: Miami InSAR Time-series software in Python, GitHub repository. Available at https://github.com/insarlab/MintPy
The Miami INsar Time-series software in PYthon (MintPy as /mɪnt paɪ/) is an open-source package for Interferometric Synthetic Aperture Radar (InSAR) time series analysis. It reads the stack of interferograms (coregistered and unwrapped) in ISCE, ARIA, FRInGE, HyP3, GMTSAR, SNAP, GAMMA or ROI_PAC format, and produces three-dimensional (2D in space and 1D in time) ground surface displacement in line-of-sight direction. It includes a routine time series analysis (smallbaselineApp.py) and some independent toolbox.
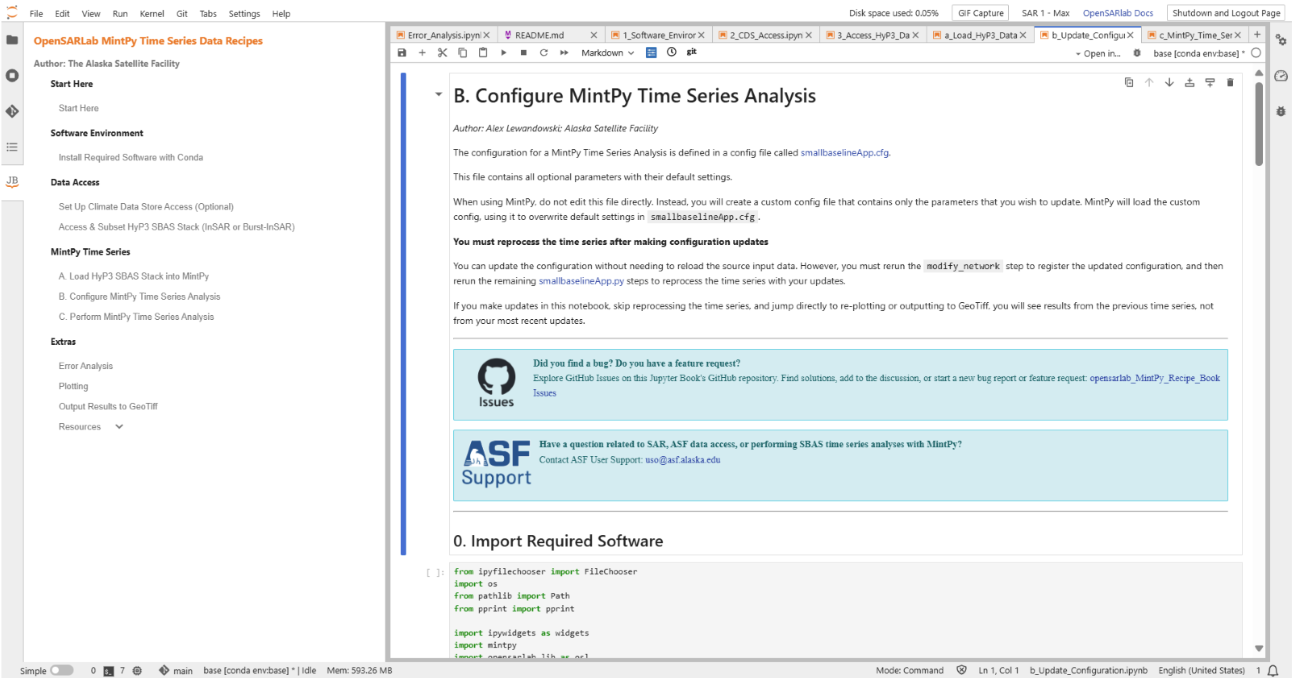
Users can also consider using the Open SAR Lab, which is a cloud-based interactive computing environment developed by the Alaska Satellite Facility (ASF) to support SAR data processing and analysis. It provides Jupyter Notebook-based workflows for SAR data handling, making it accessible for users at different expertise levels. The lab supports various SAR tools and algorithms, including MintPy, for advanced time-series InSAR analysis.
The Jupyter Book contains data recipes for loading ASF HyP3 INSAR_GAMMA and INSAR_ISCE_BURST stacks into MintPy and performing Small Baseline Subset (SBAS) line-of-sight, displacement time series analyses. It also provides options for error analysis, plotting, and outputting data to GeoTiff.
- ASF OpenSARLab. (n.d.). OpenSARLab MintPy Recipe Book. GitHub repository. Retrieved [date], from https://github.com/ASFOpenSARlab/opensarlab_MintPy_Recipe_Book
How To Use the Jupyter Book:
- Install the software environment needed to run the notebooks
- Configure Climate Data Store Access (optional)
- Access HyP3 Data
- Load Data with MintPy
- Configure a Time Series Analysis
- Perform the Time Series Analysis
- Run Post-Time Series Workflows
- Update Your Configuration and Reprocess the Time Series
Analysis Result
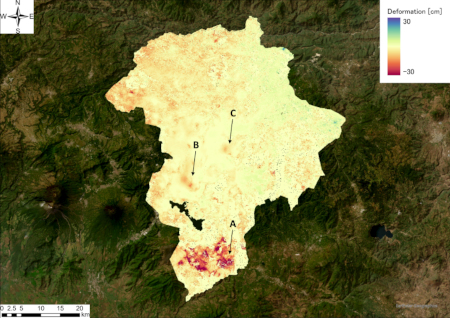
The cumulative deformation map shows some subsided spots. Temporal coverage of the result is from 5/1/2020 to 22/10/2024. There are some significant subsidence signals on the map from A to C on the map.
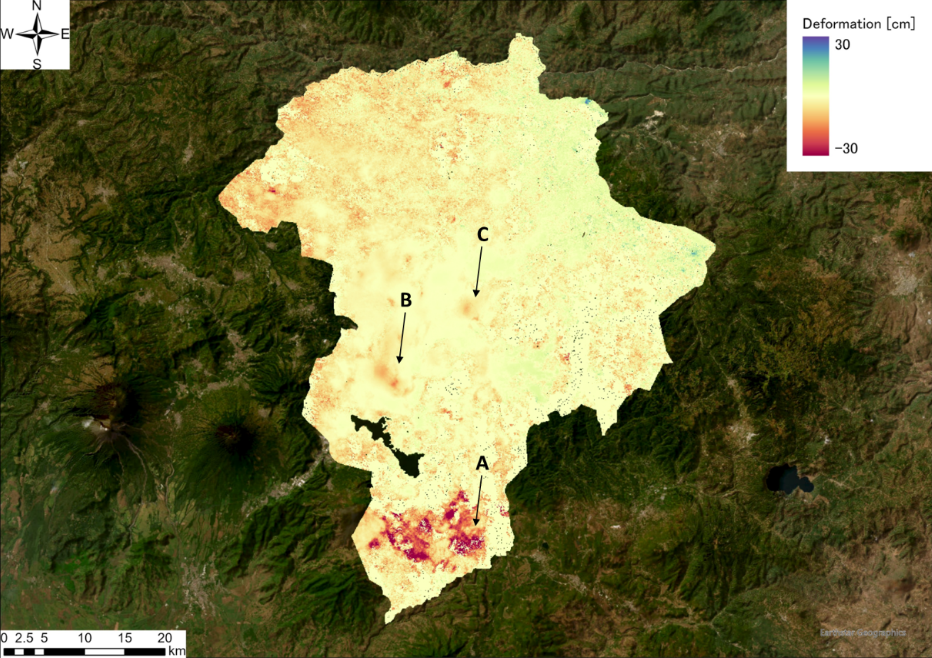
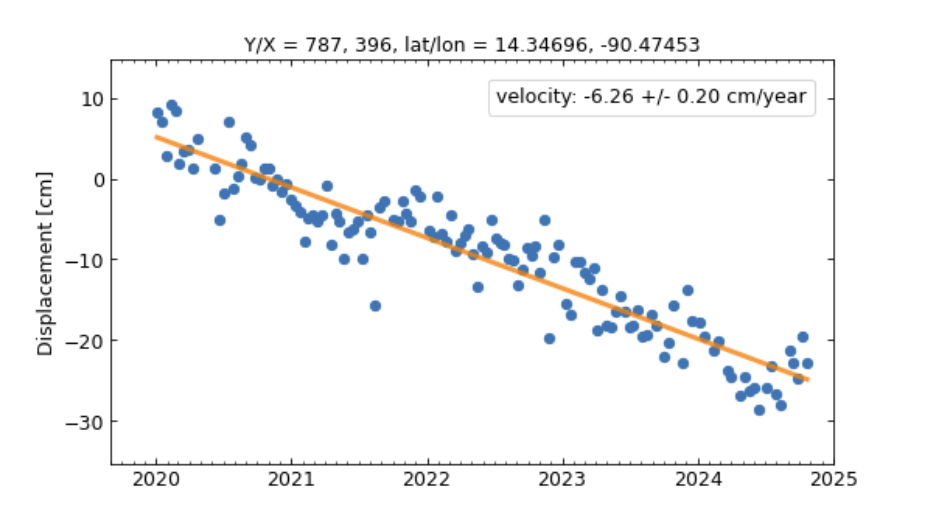
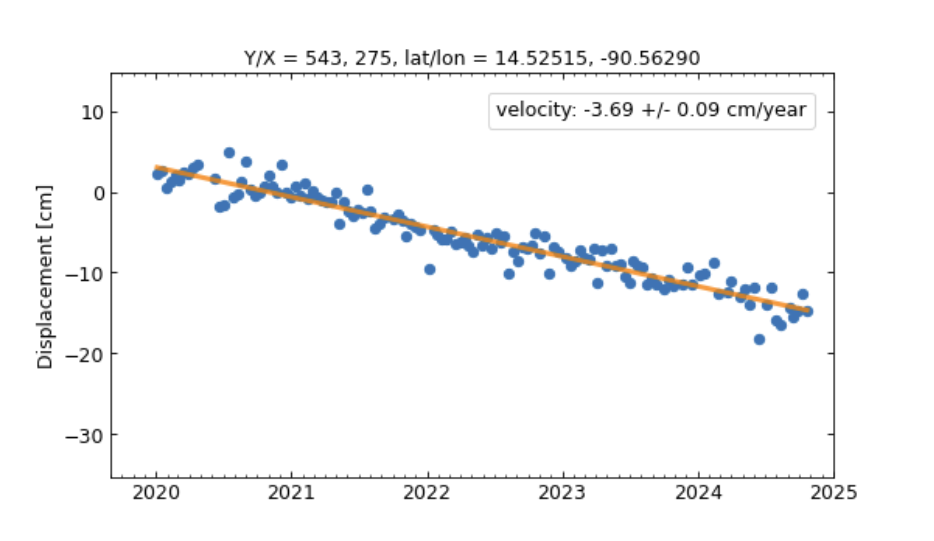
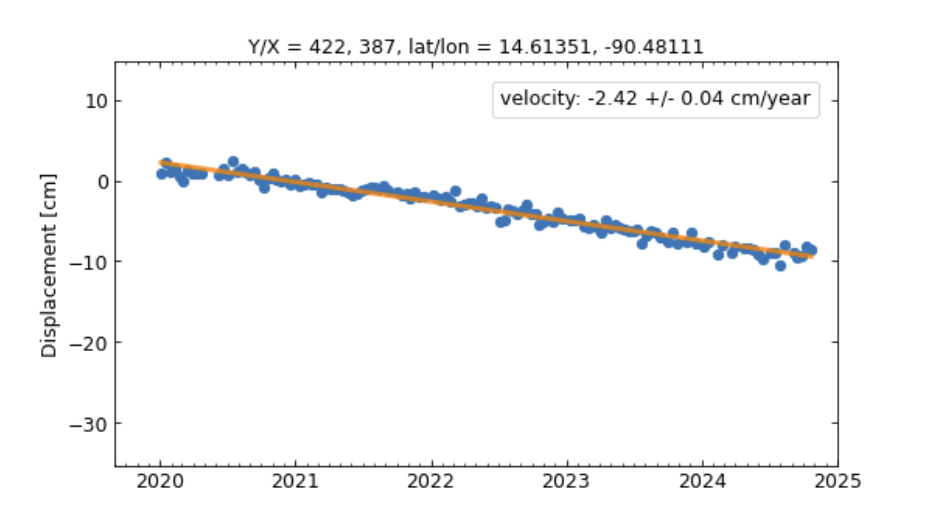
There was a significant subsidence at point A. The area showed approximately -6.26 cm/year (+/- 0.20 cm/year) subsidence in the line-of-sight (LOS) direction. In point B, it had a velocity of -3.69 cm/year (+/- 0.09 cm/year) in the LOS direction. Point C also showed -2.42 cm/year (+/- 0.04 cm/year) in the LOS direction.
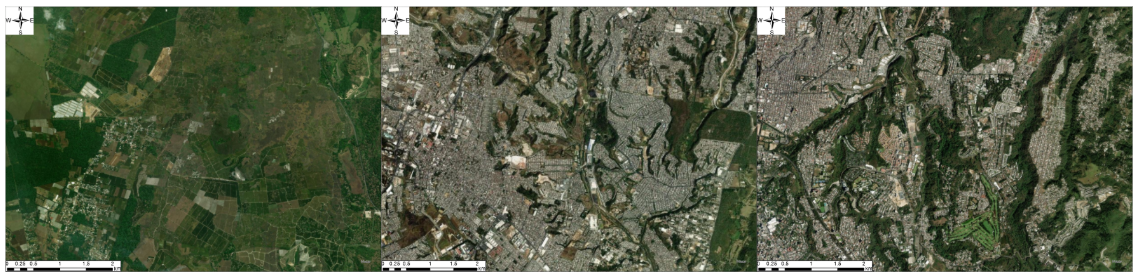
As for Point A where there has been significant land subsidence happened showed up to around 30 cm subsidence. The photo shows the paddy field around this location. As for Point B, there has been a subsidence around urban areas, and as for Point C, there has been a slow speed subsidence around vegetated hill slope area.
Jupyter Notebook provides several interim products:
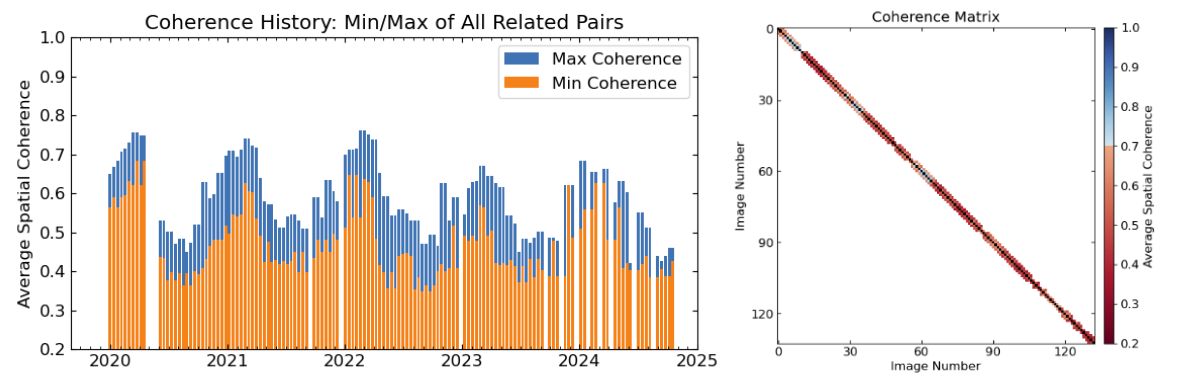
- ifgramStack_coherence_spatialAvg.txt: Contains interferogram dates, average coherence temporal and spatial baseline separation.
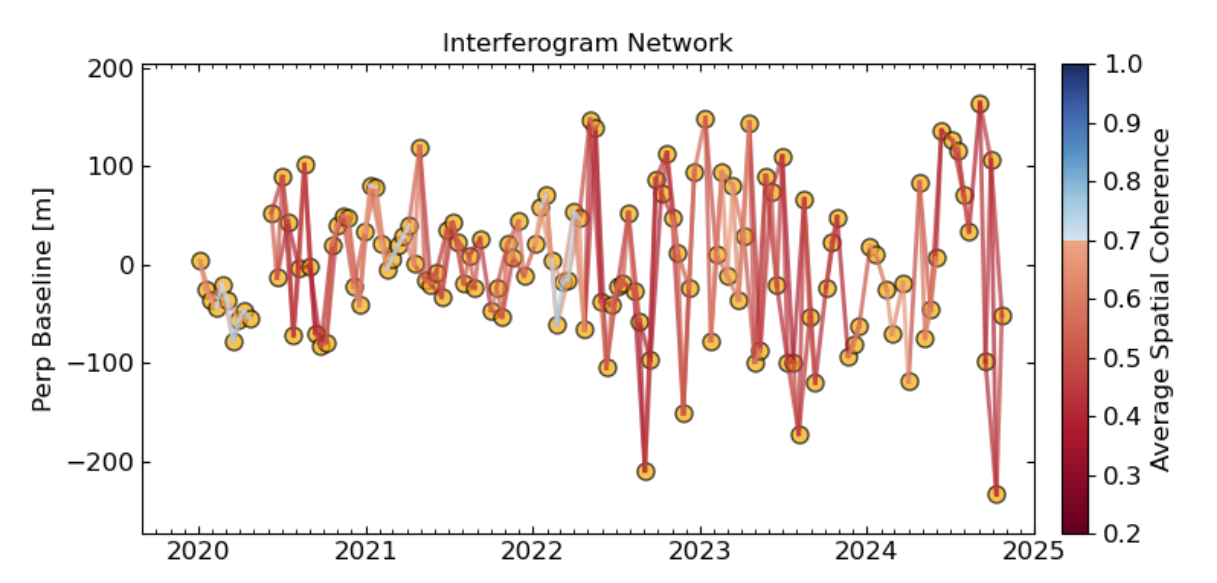
- Network.pdf: Displays the network of interferograms on time-baseline coordinates, color coded by average coherence of the interferograms.
- CoherenceMatrix.pdf: Shows the average coherence pairs between all available pairs in the stack.
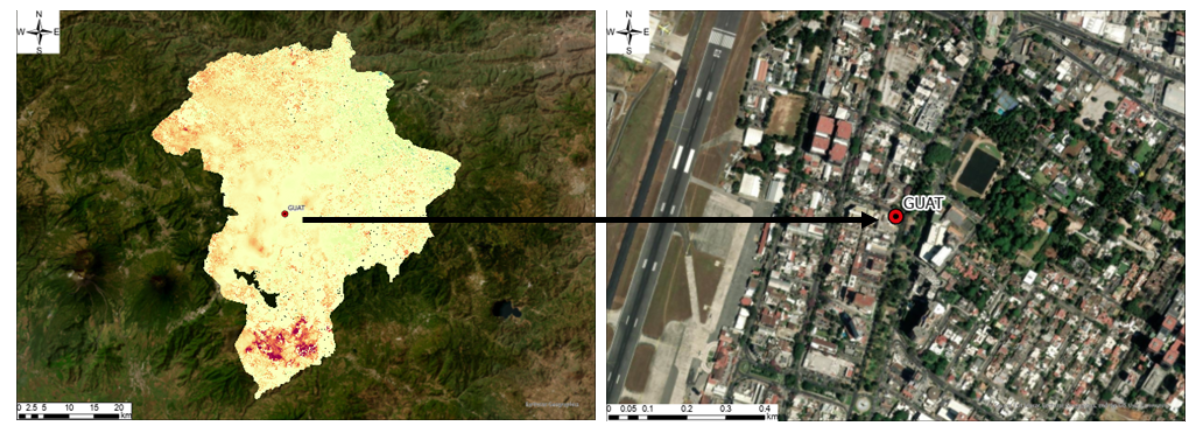
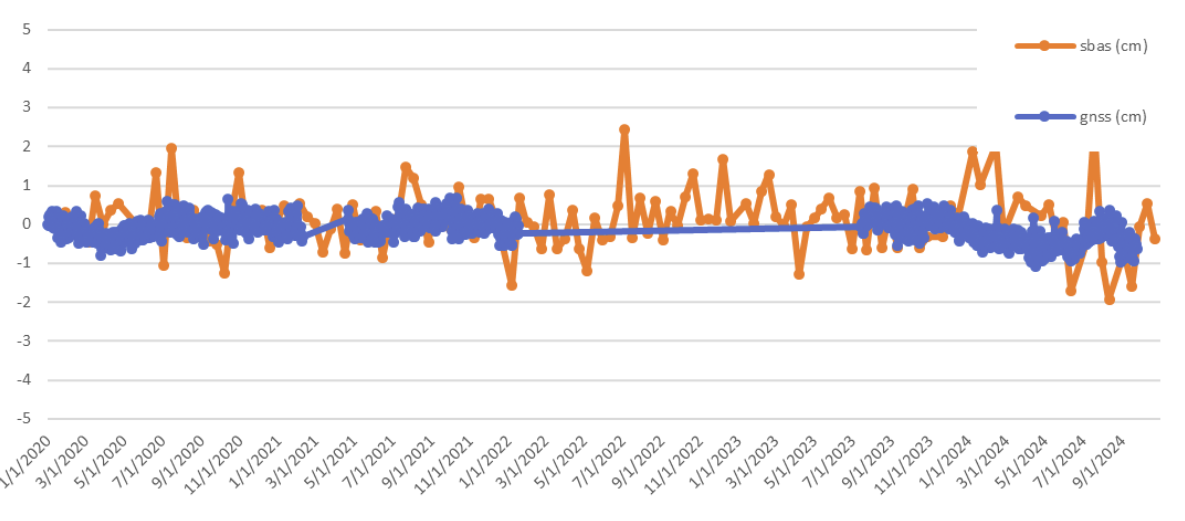
In the city, there is only one GNSS station that provides data for the public. The accuracy evaluation compared with GNSS data shows potential of the reliable result. As the GNSS also shows, the SBAS time series result also shows the steady land deformation from 2020 Jan to 2024 Oct. The SBAS result shows more fluctuation compared to GNSS result, but this is due to correction errors and due to the result only of LOS and Ascending orbit. The GNSS data was downloaded from the University of Nevada, Reno GPS station (MAGNET + Global GPS Network Map) (Blewitt, Hammond, & Kreemer, 2018). The station ID is GUAT located at Latitude: 14.590 degrees, Longitude: -90.520 degrees, and Height: 1519.881 meters.
Conclusion
The use of Multi-Temporal Interferometric Synthetic Aperture Radar (MT-InSAR) analysis has proven to be a highly effective technique for monitoring land subsidence, particularly in regions like Guatemala City, which is vulnerable to geohazards such as sinkholes and landslides. The results from this study, which utilized Sentinel-1 SAR data from January 2020 to October 2024, reveal significant ground displacement in several key locations, notably in urban and agricultural areas. The data analysis shows varying rates of subsidence, with some areas experiencing up to -6.26 cm per year, highlighting the need for ongoing monitoring and mitigation strategies.
Through the application of advanced processing techniques such as Persistent Scatterer Interferometry (PSI) and Small Baseline Subset (SBAS), we have been able to isolate and analyze subsidence signals with high precision, validating the results against GNSS data to ensure accuracy. The study also underscores the importance of integrating SAR-based displacement time series with ground truth measurements for a comprehensive understanding of land deformation patterns.
In conclusion, MT-InSAR offers a powerful tool for early detection and risk management of land subsidence, providing valuable insights for environmental impact assessments, urban planning, and disaster mitigation efforts. Given its ability to monitor large, inaccessible areas with high temporal resolution, this technique is invaluable for addressing the growing challenge of anthropogenic land subsidence, especially in regions with weak geological formations and limited infrastructure for conventional monitoring.
Reference
Gambolati, G., & Teatini, P. (2021). Land subsidence and its mitigation. The Groundwater Project. https://books.gw-project.org/land-subsidence-and-its-mitigation/
De León, H., & Monterroso, D. A. (2016). Consideraciones sobre condiciones físicas asociadas al deslizamiento en el sector El Cambray II municipio de Santa Catarina Pinula departamento Guatemala. Revista Científica CONRED, 1(1), 20.
Cunningham, C. G. (1984). Earth and water resources and hazards in Central America. U.S. Department of the Interior, Geological Survey.
Waltham, T. (2008). Sinkhole hazard case histories in karst terrains. Quarterly Journal of Engineering Geology and Hydrogeology, 41(3), 291–300. https://doi.org/10.1144/1470-9236/07-211
NBC News. (2007, February 20). Saudi prince sues ex-wife over child custody. Retrieved December 31, 2024, from https://www.nbcnews.com/id/wbna17303991
Yunjun, Z., Fattahi, H., & Amelung, F. (2019). Small baseline InSAR time series analysis: Unwrapping error correction and noise reduction. Computers & Geosciences, 133, 104331. https://doi.org/10.1016/j.cageo.2019.104331
Alaska Satellite Facility (ASF). (n.d.). Welcome to ASF OpenSARLab. Retrieved Retrieved December 31, 2024, from https://asf.alaska.edu/asf/welcome-to-asf-opensarlab/
Y. C. Kim, D. -j. Kim and J. Jung, "Monitoring Land Subsidence in Guatemala City Using Time-Series Interferometry," IGARSS 2019 - 2019 IEEE International Geoscience and Remote Sensing Symposium, Yokohama, Japan, 2019, pp. 2099-2102, doi: 10.1109/IGARSS.2019.8899774.
Blewitt, G.,Hammond, W. C., and Kreemer, C. (2018), Harnessing the GPS data explosion for interdisciplinary science, Eos, 99, https://doi.org/10.1029/2018EO104623. Published on 24 September 2018.