United
Nations
Office for Outer Space Affairs
UN-SPIDER Knowledge Portal
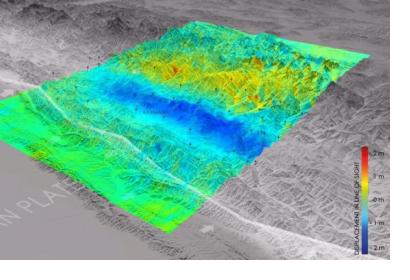
An image based on satellite data from the European Sentinel-1A satellite shows how and where the land uplifted and sank from the 7.8-magnitute earthquake that struck Nepal on 25 April 2015. Using satellite data generated before and after the earthquake, experts at the German Aerospace Center’s Earth Observation Center (EOC) created the image showing the different movements of the zones.
Near the boundary of the Indian and Eurasian tectonic plates, blue shows areas of uplift of up to 0.8 m towards the satellite (called ‘line of sight’) which could be caused by a vertical uplift of 1 m. The yellow area depicts areas of subsidence, a movement that often occurs as a counter movement to the uplift in subduction zones (where one plate dips below the other) during earthquakes. In the image, the locations of numerous aftershocks in recent days are also displayed.
Scientists at the EOC are continuing to compare archival data of the area with the latest radar images from Sentinel-1.
