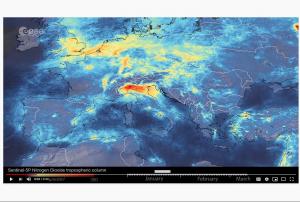
Data from the Copernicus Sentinel-5P satellite show the decline of air pollution, specifically nitrogen dioxide concentrations, over Italy. This reduction is particularly visible in northern Italy which coincides with its nationwide lockdown to prevent the spread of the coronavirus.
The animation shows the fluctuation of nitrogen dioxide concentrations across Europe from 1 January 2020 until 11 March 2020, using a 10-day moving average. While there could be variations in the data due to cloud cover and changing weather, ESA is confident that the reduction of concentrations visible coincides with the lockdown causing less traffic and industrial activities.