What are Harmful Algal Blooms?
Certain algal produces toxins that, in large amounts, can be harmful to marine life and potentially to humans. Algae forming these dense layers are described as harmful algal blooms (HABs). Monitoring of harmful algal blooms is important for freshwater ecosystems to prevent the contamination of local drinking water sources as well as in coastal regions to avoid shellfish poisoning, and economic losses through impacts on local fisheries and tourism. Fish kills can result from the associated toxins or from the immense depletion of oxygen caused by the increased algal activity. General conditions that favour algal blooms are rising seawater temperatures and high nutrient loading from fertilizers. However, there are many different types of phytoplankton which tend to form a bloom in different areas.
Content
- Introduction to HABs
- How can HABs be monitored from space?
2.1 Visual monitoring (Colour)
2.2 Quantitative indices (Chlorophyll A, FLH, HAB indicator, Red Tide indicator) - Effect of regional conditions on space-based HAB monitoring
- Available satellites for monitoring HABs
- Requirements and limitations of remote sensing for HAB monitoring
- Remote sensing and in-situ monitoring
- Regional/International working groups on HAB monitoring
- Data sources
- Software sources
- Training material
- Bibliography
1. Introduction to HABs
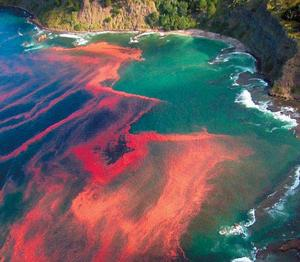
A common term to describe HABs is “red tide”, which stems from the brown and red coloured photosynthetic pigments exhibited by certain species of phytoplankton. A known species that fall into this category is the Karenia brevis. It produces potent neurotoxins, so-called brevetoxins, and is prevalent in the Coast of Florida and the Gulf of Mexico.
 |  |
|---|---|
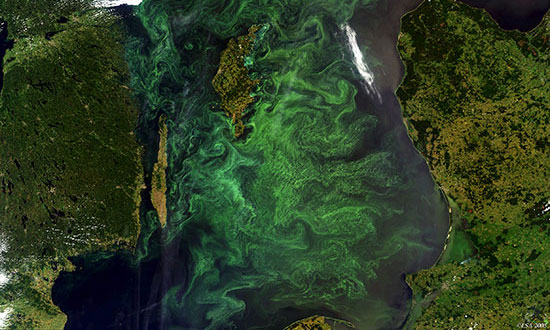
| Red algal bloom at Leigh, near Cape Rodney, New Zealand. Image: Miriam Godfrey for New Zealand's National Institute of Water and Atmospheric Research | MERIS image of 13 July 2005 over the Baltic Sea showing a large algal bloom of cyanobacteria. Image: ESA
|
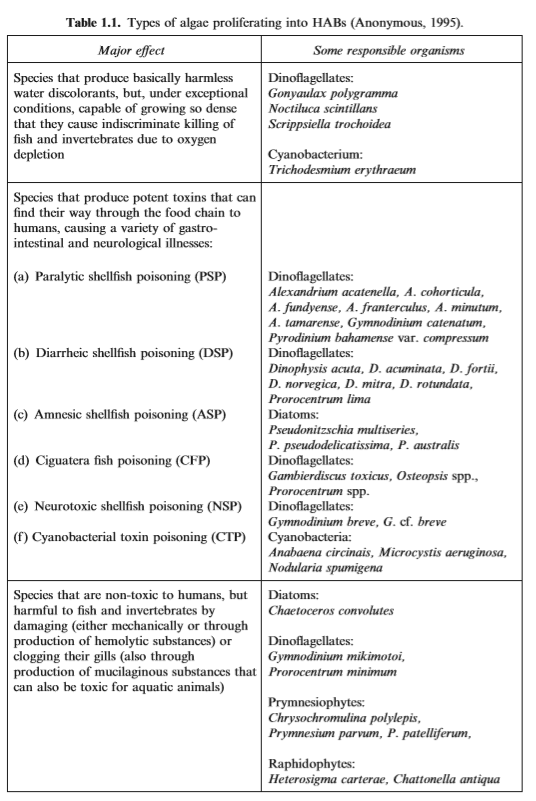
Blue-green algae, which are formed by cyanobacteria, are also counted to the group of HABs. Cyanobacteria have characteristics of both algae and bacteria and can be monitored in a similar way as other algae (World Health Organisation). Special attention is paid to cyanobacteria as they also produce toxins that can be harmful to animals and humans. However, many more species and toxins exist (Pettersson and Pozdnyakov, 2013). A list of responsible organisms is shown below. Furthermore, the regional prevalence of species and toxins are listed on the Woods Hole Oceanographic Institution's page on Harmful Algae.
Types of algae proliferating into HABS (Pettersson and Pozdnyakov, 2013 Table 1.1)
Regional prevalence of HABs
According to Shen, Xu, and Guo 2012, “[e]very year many coastal regions throughout the World are threatened by the serious ecological problems associated with huge economic losses and health issues caused by HABs. Their paper summarizes studies on Hong Kong's waters, the East China Sea, the Korean South Sea, the Japanese Sea, the Gulf of Tokin, the Arabian Sea, the coast of France, the coast of Portugal, New Zealand's waters, the Galician Rias, the Baltic Sea, the Gulf of Mexico, Washington, the Gulf of California, the coast of Florida, the Gulf of Maine, the coast of Nova Scotia, the coast of British Columbia and the South African coast. All of the areas are "subject to HABs with bewildering tendencies of larger spatial extents and higher frequencies” (Shen, Xu, and Guo 2012).
Studies of the region of interest are important in order to find the predominant species of algae and the type of toxin to be expected of the region. The Harmful Algae Page by the Woods Hole Oceanographic Institution (WHOI) presents maps of the where the six various poisons are dominant as well as where fish kills associated with HABs occur.

Figure 2. Global Distribution of harmful algal blooms. Image: WHOI
2. How can HABs be monitored from space?
2.1 Direct visual monitoring of ocean colour:
Satellite images measure the reflectance of the ocean, providing information on ocean colour (based on light intensities). The colour in which algal blooms appear on the images depends on the pigments contained in a certain type of algae and at which wavelength these pigments reflect or absorb. Chlorophyll A, for example, is a dominant pigment in algae and it reflects most strongly in the green spectrum, which makes it appear green to the human eye. The absorption by phycocyanin is low in the blue, cyan and green spectrum, thus it appears as a variation of blue or turquoise. An example of algae with high phycocyanin are cyanobacteria or blue-green algae which are shown in figure 1b.
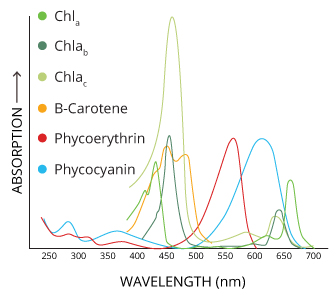
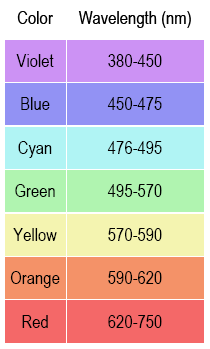
Figure 3. Light absorption of algal pigments. Image: Fondriest Environmental Inc.
Besides the colour of algae itself, other reflectances in water can be seen. The image below shows how water and plants with high chlorophyll appear green, clear water appears blue, organic matter (CDOM) appears with a slight yellow tint and sediments appear brownish.
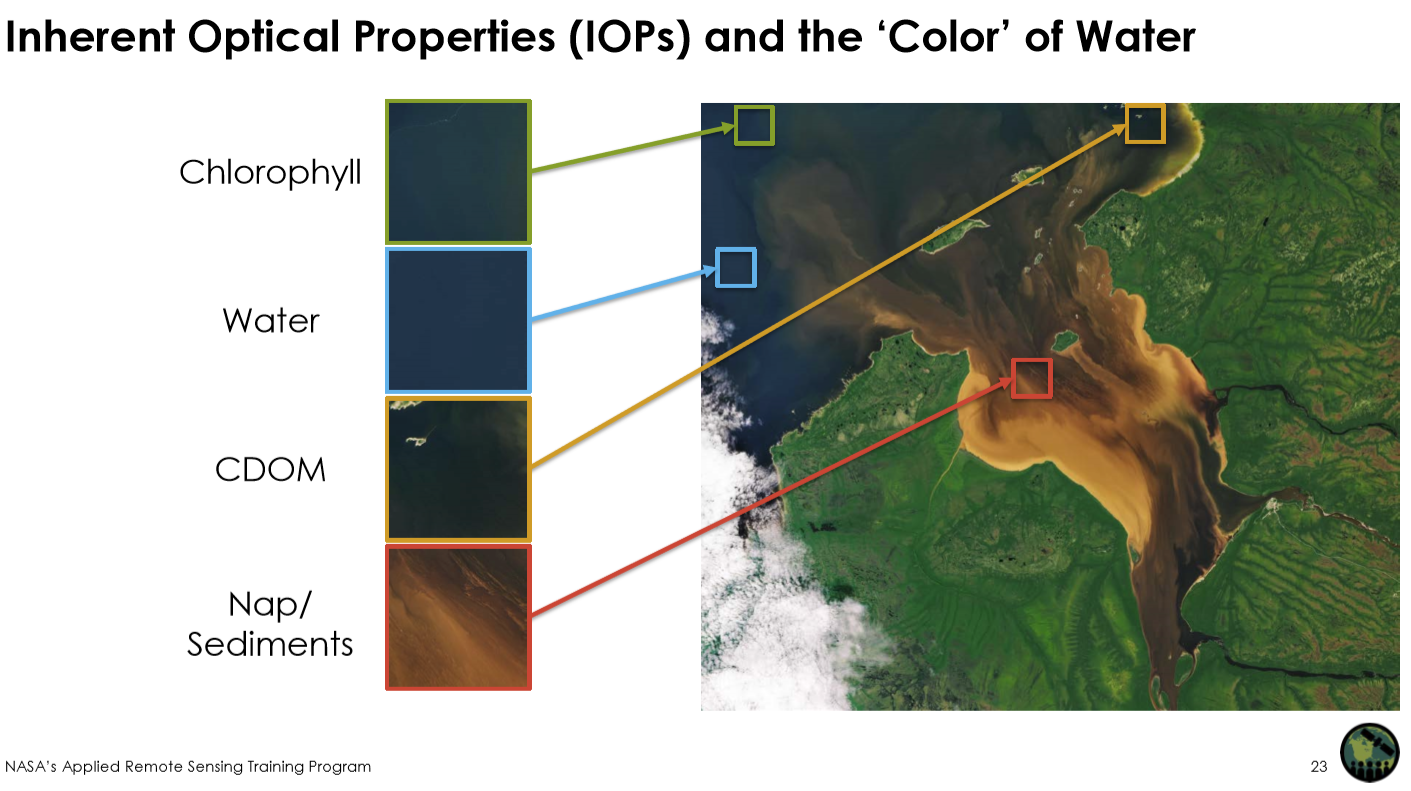
Figure 4. Inherent optical properties and the colour of water. Image: NASA Applied Remote Sensing Training Program
Visual monitoring through enhanced optical images (ERGB)
Since the difference in the colour of the ocean is not very clear, enhanced optical images (ERGB) are used to detect algal blooms. They are created by choosing the red, green and blue band of a satellite and stretching the colour values in the range of water, so that differences in the ocean colour are easier to observe. Instead of the previous colour range, brownish/reddish colour is often “attributed to high concentrations of phytoplankton; the bright colour is caused by sediment-rich waters and/or shallow bottom reflection; and the darkish colour results from high concentration of phytoplankton and/or coloured dissolved organic matter (CDOM)” (Zhao et al 2014). A lesson on how to use ERGB images, chlorophyll and in situ data to monitor algal blooms is presented on LearnEO.
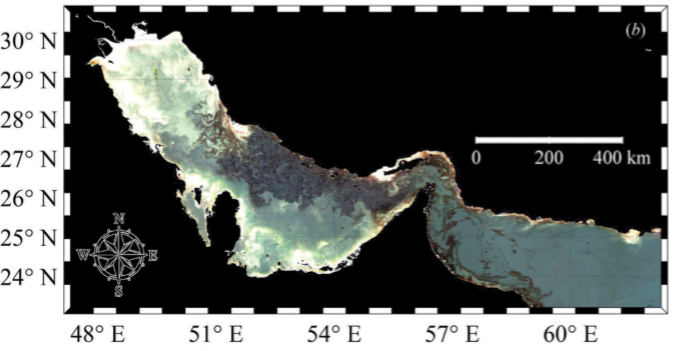
Figure 5. MODIS/Aqua-derived Enhanced Red-Green-Blue (ERGB) image collected on 23 December 2008 over the Gulf of Oman. Dark brown colour in the ERGB image indicates the occurrence of algal bloom. (Zhao et al. 2016)
2.2 Monitoring through indices:
Quantitative and qualitative indices can also help automate algae bloom monitoring, and allow for a calculation of biomass and in some cases a determination of the species present. Most algorithms focus on the determination of the chlorophyll-A concentration and fluorescence line height (FLH). The fluorescence line height is an indicator of energy re-emitted by chlorophyll molecules after photosynthesis.
The most common spectral band-rations to retrieve CHl-a values used are blue-green (440-550nm) spectral band-rations developed from empirical data. This is because most of the phytoplankton absorption occurs within this portion of the visible spectrum (Blondeau-Patissier et al. 2014).
When optical imagery cannot be used due to cloud coverage, radar data can be used to sense the reflectance and emitted backscatter of the Earth surface. Since algae cause visible changes in the water surface structure, synthetic aperture radar (SAR) bands can also be used to detect algal blooms.
Figure 6. A contrast of MODIS/Aqua-derived chlorophyll-a map (using the default OC3 M algorithm) with ERGB image (Zhao et al. 2016).
Chlorophyll (Chl-A, Chl Anomaly, MCI, NCDI)
Derived chlorophyll indexes depend on the satellite and algorithm used in their development. The Chl-a values in [mg/m3] available on NASA’s ocean colour website is produced combining two algorithms, the O'Reilly band ratio (OCx) algorithm and the Hu colour index (CI) algorithm. The coefficients used are sensor-specific and can be found on at NASA ocean colour website.
While high Chl-A values are an indicator of harmful algal blooms as there are seasonal variations in the chlorophyll presence in oceans or lakes, Chl anomalies calculated by assessing the values of a certain date to a mean of a few weeks prior to the date are often used to highlight algal blooms.
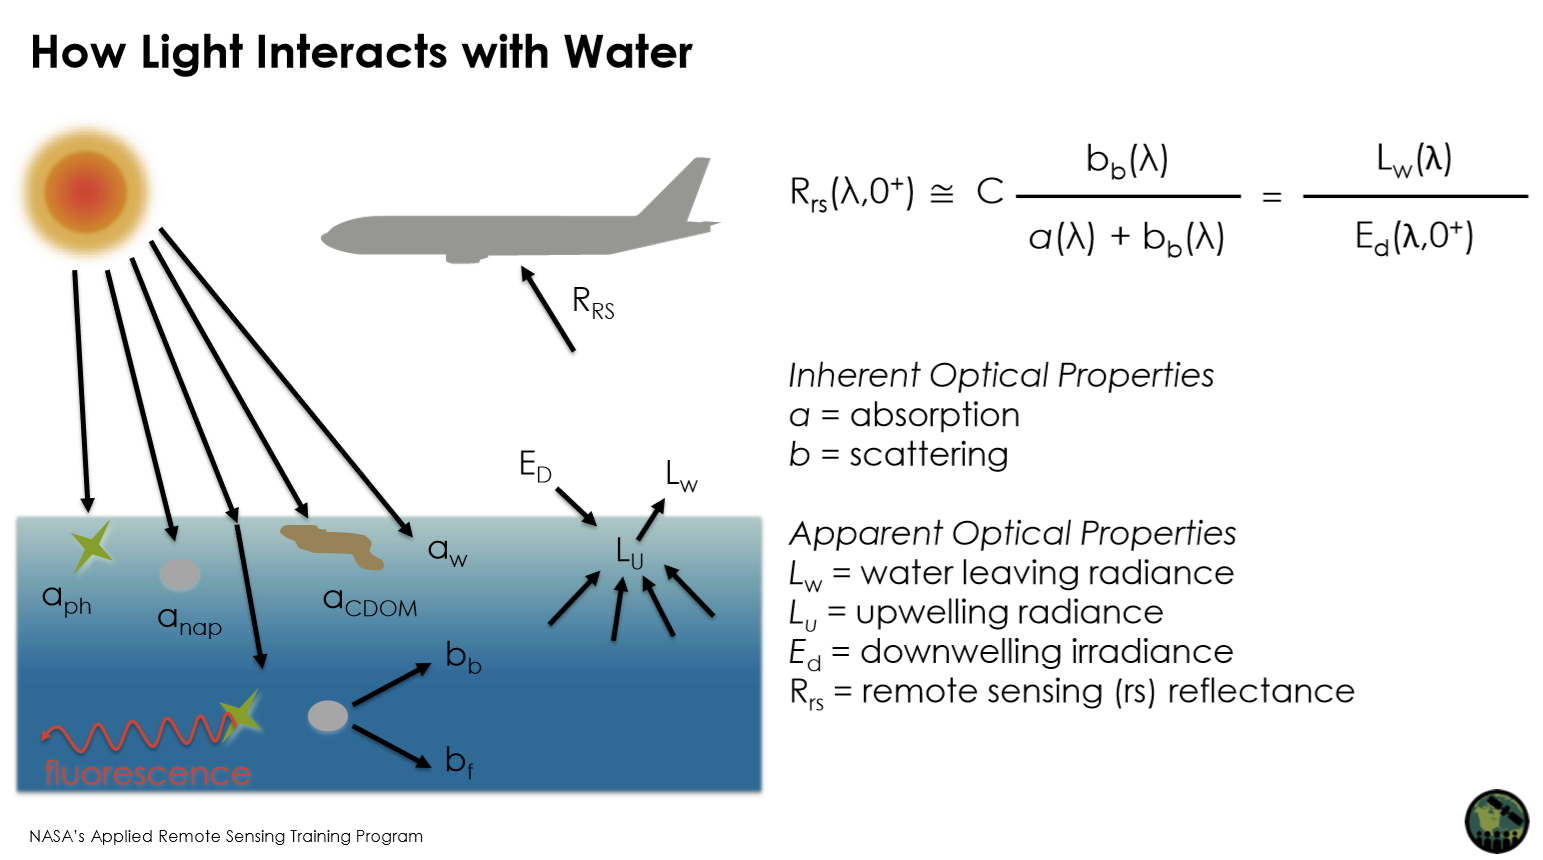
Figure 7. How light interacts with water. Image: NASA ARSET Advanced Water Monitoring Webinar Sep 2018
While Chl-A is derived from remote sensing reflectances Rs, many algorithms apply the water leaving reflectance (L,w) or in particular the normalized water-leaving reflectance (L,wn), which is less dependent on solar zenith angle, viewing direction or atmospheric conditions. The values of. Descriptions and calculations used for various parameters are presented here Normalized reflectance).
Harmful Algal Bloom Index (HABi) or Red Tide Index (RI)
Researchers and private companies have developed some specific indicators that can detect specific types of algae. The Harmful Algae Bloom Index (HABi) by EOMAP specializes on detecting blue algae containing phycocyanin pigments, while the Red Tide Index (RI) tracks the reflectance of carotenoid photopigments present in the species K. brevis. Further research on the detection or evaluation of algae blooms by kind is underway and since the species occurrence varies by location, the use of specific indicators for certain regions is needed.
Surface Algal Bloom Index (SABI)
The SABI algorithm detects biomass floating at the water surface which has a NIR response similar to that of land vegetation (Alawadi 2010). It is an empirical band difference ratio similar to the NDVI, but specifically includes ocean-sensitive spectral bands; the blue (characteristic of clear water) and green (characteristic of the water column bloom). For Modis the bands correspond to: B1 (XR=645 nm) and B2 (XNIR=869 nm), both aggregated from the 250 m resolution MODIS band group; and bands B3 (XB=469 nm) and B4 (XG=555 nm), respectively available within the 500 m resolution MODIS band group (Alawadi 2010).
![]()
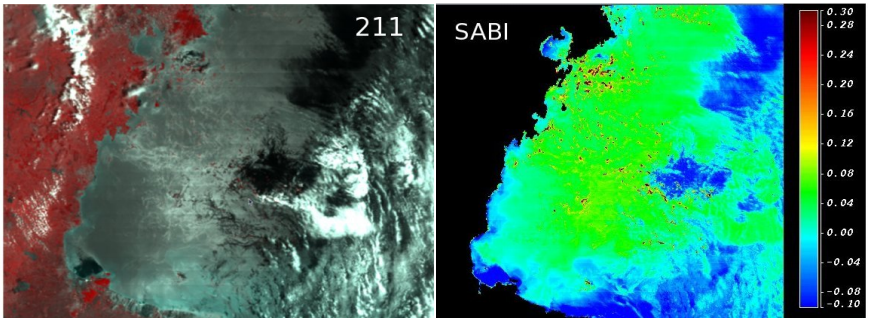
Figure 8. Ulva prolifera bloom in the Yellow Sea (Terra, 25 June 2008) and SABI images. (Alawadi 2010)
Blue Normalized Vegetation Index (BNDVI)
The blue normalized difference vegetation index (BNDVI) is an band index specifically for cyano bacteria correlated with biomass densities at the water surface. The band ratio can be compared to the volume of cyano bacteria cells in a sample of the water column, also referred to as buoyant packed cell volume (BPCV). Its calculation requires only the NIR and blue bands and can be of use if the dominant HAB in an area are cyano bacteria. (Van der Merwe and Price 2015)
![]()
Floating Algae Index (FAI)
The FAI index identifies only species that exhibit a “red-edge” in their above-water reflectance spectrum, which is one way of distinguishing macroalgae from phytoplanton or other submerged aquatic vegetation. It can be used to quantify the number of floating macroalgae pixels (Garcia et al. 2013).
where, RRC is the Rayleigh corrected top‐of‐atmosphere reflectance; λ(SWIR), λ(NIR), and λ(RED) are the wavelengths of the SWIR, NIR, and red bands, respectively. The FAI shows significant improvement in reducing the variability observed in regions affected by Sun‐glint or a hazy atmosphere. The FAI is, however, sensitive to turbid water.
Additional parameters
Many integrated models further make use of additional parameters such as the sea surface temperature, or wind and current models. These parameters contribute to algae bloom formation through upwelling of dense, cooler nutrient-rich water to the ocean surface that stimulates the growth of phytoplankton. Upwelling zones can be identified by cool sea surface temperatures (SST) and high concentrations of chlorophyll-a. One example of ocean circulation models is HYCOM, a global generalized ocean model of which data and source codes are available here).
3. Effect of regional conditions on space-based HAB monitoring
Algae occur in inland waters, coastal waters and in the open ocean. In all cases, satellite monitoring only retrieves the reflectance of the upper surface layer, so algal blooms that occur in deeper layers are not measurable. Nevertheless, remote sensing algorithms need to pay attention to the composition of water in the different water bodies. In the open ocean - typically referred to as type 1 waters - phytoplankton is the primary constituent (Morel 1980)[q]. Therefore, phytoplankton is empirically related (via formulas with coefficients that were found experimentally) to the water-leaving reflectance and empirical blue-green spectral band-ratios can be applied to assess Chl-a concentrations.
Coastal waters and freshwater lakes are termed type 2 waters because they are more optically complex as they are affected by many components such as sediments. In these cases, Chl-a cannot be retrieved as reliably from green-blue band rations, but additional information from the red and NIR bands may be used (Blondeau-Patissier et al. 2014).
Dust and water vapour above the area of interest also affect the measurement of HABs with optical satellite imagery. Particularly, in the Gulf of Oman, where the atmosphere is generally loaded with high levels of dust and has high water vapour the accuracy of standard ocean colour methods may be affected. Regional differences in atmospheric reflectance must be taken into account in the AOT corrections. (Zhao et al. 2016)
4. Available satellites for monitoring HABs
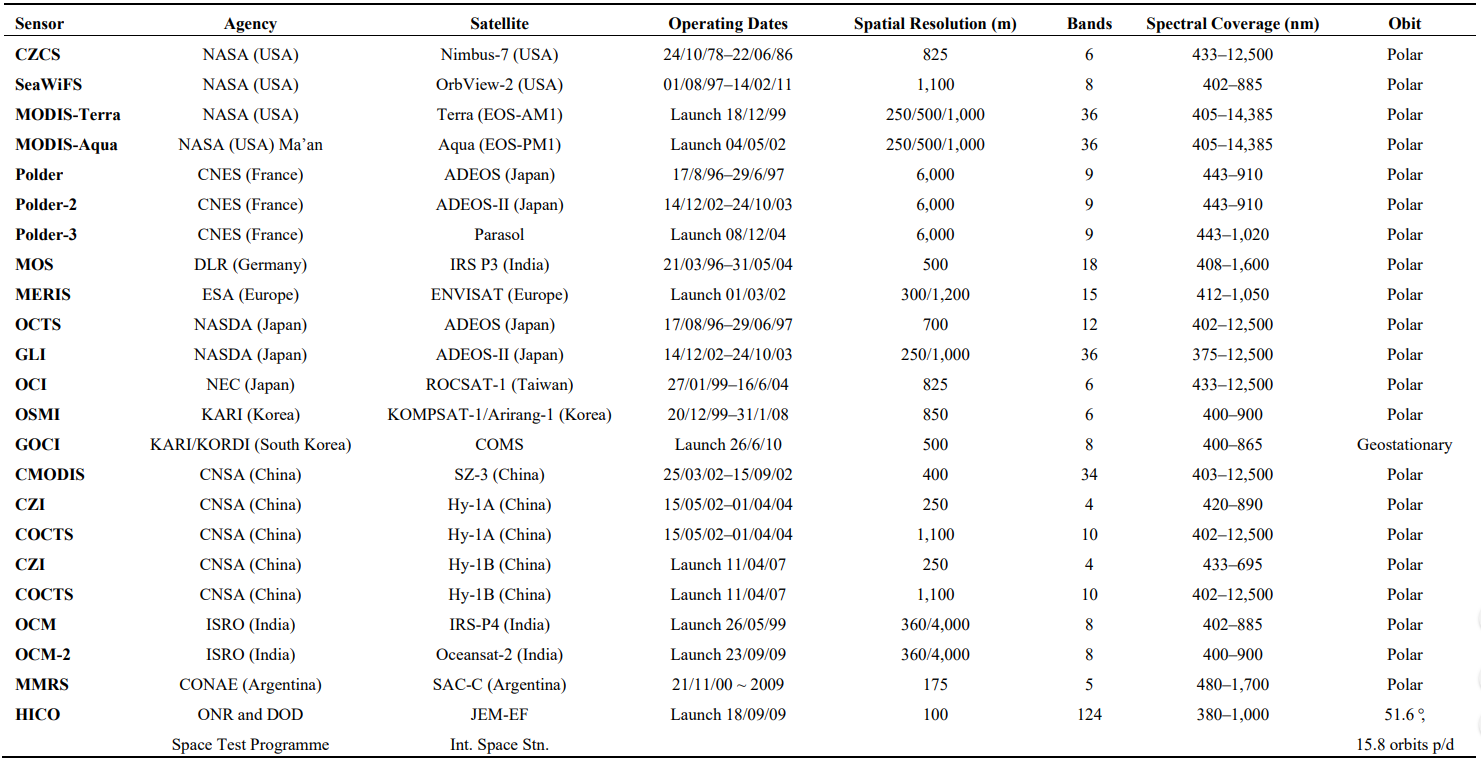
Table 2 presents satellites which can be used to monitor HABs. Additionally, two satellites not captured in table 2 and relevant to monitoring HABs from space were launched in the years 2016 and 2018: the Sentinel 3 twin satellites which carry the Ocean and Land Colour Instrument (OLCI) and replaced MERIS ENVISAT. They represent an improvement in exposure to sunglint errors over MERIS, as sun glint contaminated more than half of the MERIS observations at sub-tropical latitudes (ESA).
Table 2 Characteristics of ocean colour sensors (Shen, Xu, and Guo 2012)
5. Requirements and limitations of remote sensing for HAB monitoring
The ability of remote sensing to detect HABs strongly depends on the size of the blooms and the resolution of the instrument chosen. Ocean colour data from SeaWiFS and MODIS available at 1 km resolution can only be used to detect large blooms on the open ocean, but are too coarse for mapping blooms in the coastal zone. MERIS and its successor Sentinel 3, however, are able to detect blooms in the range of 300 sq. meters. Apart from the resolution and the quality of measurement expected from the instrument, a satellite’s revisit time over the area of interest also determines how well an Algal bloom can be monitored.
Overview of algorithms available (by satellite)
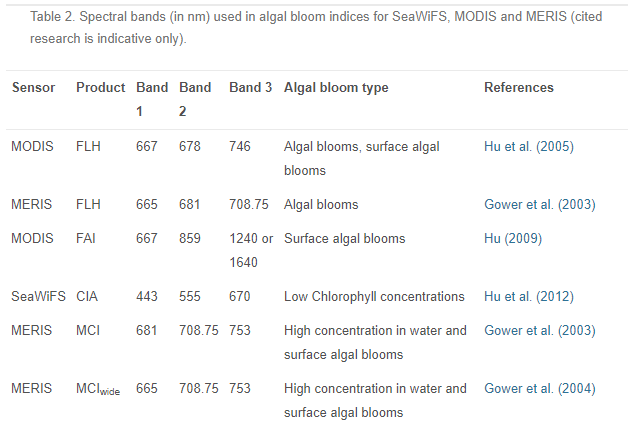
Algorithms must be adapted to the spectral band ranges observed by various satellite types. Table … below indicates which bands are used to create the desired product (FLH = Fluorescence Line Height).
Table Bands used in algorithms for algal bloom indicators for MODIS, MERIS, SeaWiFS (Blondeau-Patissier et al. 2014).
Potential false positives
Even when the best-matched algorithm is used, an area indicated by the product as a potential algal bloom may not be a HAB after all. First, not all detected algal blooms are harmful or they may be indicating a phenomenon with a similar appearance. In the case of radar satellite imagery, algal blooms may appear similar to oil spills.
Limitations
Overall, the determination of HABs with remote sensing still requires in situ verification. Some algorithms are likely to fail in coastal zones due to problems with the atmospheric correction or the fluorescence line height signal may be masked due to the influence of dissolved organic and total suspended matter (McKee et al. (2007). Shen, Xu, and Guo 2012 note however that “although it is difficult for satellite remote sensing to detect high toxicity HABs existing in thin layers, it still provides an effective tool for identifying high-biomass HABs such as red tides.”
Management of harmful algal blooms also requires knowing which species with which toxic is present. Due to the multitude of species and toxics and the limitation of remote sensing to observe certain spectral characteristics, this is not always possible. For some distinct HAB species, indicative spectral characteristics have been found. Zhao et al. 2010 concluded that three main spectral characteristic types (the single-peak, the double-peak and the wide peak) exist for most HAB species. The single peak is characterized by a single reflectance peak at 680–750 nm (e.g., for the species Heterosigma akashiwo and Ceratium furan) while the double-peak type has a strong reflectance peak at around 700 nm and a weak peak at around 800 nm (e.g., Gymnodinium spp., Pyramimonas spp.). The wide-peak type has a relatively broad reflectance peak distributed from 680 to 900 nm (e.g., Platymonas spp., Nitzschia closterium and Chlorella spp.)
6. Combining remote sensing and in-situ monitoring
Although remote sensing is a powerful tool for algal bloom detection, integration with other data sources and especially in-situ validations are required to assure the accuracy of observations. Figure.. below indicates a framework of understanding how multiple data sources are integrated and analyzed. Furthermore, a training lesson on using remote sensing to detect harmful algal blooms and integrate in-situ and satellite data is available at LearnEO)
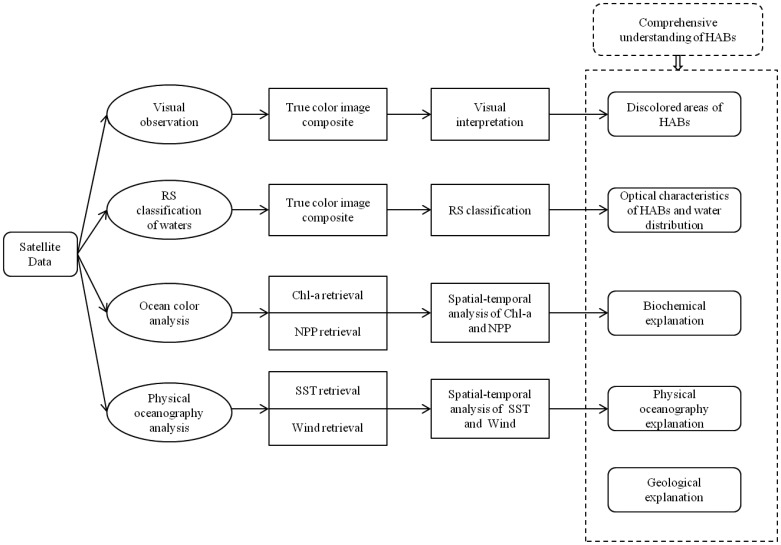
Figure 9. A synthesized framework of satellite remote sensing for detecting HABs. Image: Shen, Xu, and Guo 2012
Lastly, the following section presents an overview of working groups on HAB monitoring, available data sources and web maps, as well as available software for the processing and monitoring of satellite images.
7. Regional/International working groups on HAB monitoring
- Intergovernmental Oceanographic Commission of UNESCO
- IOC regional working group on HAB in South America
- IOC regional working group on HAB in the Caribbean
- Sentinel products for detecting EUtROphication and Harmful Algal Bloom events (S-3 EUROHAB)
8. Data sources
Raw satellite data (Level 0, requires AOT and all basic processing)
- Application for Extracting and Exploring Analysis Ready Samples (AρρEEARS), Copernicus Open Data Hub (Sentinel -1, Sentinel -2, Sentinel 3)
Preprocessed chlorophyll maps:
- OceanColorNasa, Level 3 Visualisation
- Copernicus Near Real Time
- Sentinel 3 - OLCI, Sentinel Eumetsat map viewer
- ESA Ocean Virtual Laboratory (Worldwide: SST)
In-situ data:
- Florida Fish and Wildlife Conservation Commission: GIS point shapefile of recent sampling locations for Karenia brevis at the coast of Florida.
- NCCOS Phytoplankton Monitoring Network Data NOAA
HAB maps:
- US: Gulf of Mexico NOAA Harmful Algal BloomS Observing System (HABSOS), NOAA Phytoplankton Monitoring Network, NOAA Ecoforecasting, NOAA Lake Erie, Virginia, North Carolina Environmental Quality, California: CeNCOOS, CalHAB Program, Alaska Bulletin
- South Africa (OCIMS)
- Chile: SalmonChileIntesal, Harmful Algal Studies Center (CREAN) of the Fisheries Development Institute (IFOP) for detection of Alexandrium catenella microalga
- Peru: Instituto del mar del Peru (IMARPE)
- Europe: Copernicus Marine Environmental Service (CMEMS),
- Middle East: Regional Organization for the Protection of the Marine Environment ROPME
- Worldwide: Harmful Algae Event Database (HAEDAT), World Water Quality Information and Capacity Building Portal (IIWQ)
9. Software sources:
10. Further reading/ training resources
- NOAA
- Characteristics of historical and current ocean-colour sensors (Shen et al. 2012)
- How to create Chlorophyll Maps from Sentinel 3 data with SNAP
- ARSET Advanced Webinar: Processing Satellite Imagery for Monitoring Water Quality
- EO Learn/ Bilko Case Study (Integration in-situ and remote sensing data)
- SEOS Earth Observation Training for Ocean Colour specifically for harmful algae blooms.
11. Bibliography
Alawadi, Fahad. 2010. “Detection of Surface Algal Blooms Using the Newly Developed Algorithm Surface Algal Bloom Index (SABI).” In , edited by Charles R. Bostater, Jr., Stelios P. Mertikas, Xavier Neyt, and Miguel Velez-Reyes, 782506. https://doi.org/10.1117/12.862096.
Blondeau-Patissier, David, James F.R. Gower, Arnold G. Dekker, Stuart R. Phinn, and Vittorio E. Brando. 2014. “A Review of Ocean Color Remote Sensing Methods and Statistical Techniques for the Detection, Mapping and Analysis of Phytoplankton Blooms in Coastal and Open Oceans.” Progress in Oceanography 123 (April): 123–44. https://doi.org/10.1016/J.POCEAN.2013.12.008.
Carvalho, Gustavo A, Peter J Minnett, Viva F Banzon, Warner Baringer, and Cynthia A Heil. 2011. “Long-Term Evaluation of Three Satellite Ocean Color Algorithms for Identifying Harmful Algal Blooms (Karenia Brevis) along the West Coast of Florida: A Matchup Assessment.” Remote Sensing of Environment 115 (1): 1–18. https://doi.org/10.1016/j.rse.2010.07.007.
Garcia, Rodrigo A., Peter Fearns, John K. Keesing, and Dongyan Liu. 2013. “Quantification of Floating Macroalgae Blooms Using the Scaled Algae Index.” Journal of Geophysical Research: Oceans 118 (1): 26–42. https://doi.org/10.1029/2012JC008292.
McKee, David, Alex Cunningham, David Wright, and Lorraine Hay. 2007. “Potential Impacts of Nonalgal Materials on Water-Leaving Sun Induced Chlorophyll Fluorescence Signals in Coastal Waters.” Applied Optics 46 (31): 7720–29. http://www.ncbi.nlm.nih.gov/pubmed/17973016.
Merwe, Deon Van der, and Kevin P Price. 2015. “Harmful Algal Bloom Characterization at Ultra-High Spatial and Temporal Resolution Using Small Unmanned Aircraft Systems.” Toxins 7 (4): 1065–78. https://doi.org/10.3390/toxins7041065.
Pettersson, Lasse H., and Dmitry Pozdnyakov. 2013. Monitoring of Harmful Algal Blooms. Monitoring of Harmful Algal Blooms. https://doi.org/10.1007/978-3-540-68209-7.
Shen, Li, Huiping Xu, and Xulin Guo. 2012. “Satellite Remote Sensing of Harmful Algal Blooms (HABs) and a Potential Synthesized Framework.” Sensors 12 (6): 7778–7803. https://doi.org/10.3390/s120607778.
Zhao, Dongzhi, Xiaogang Xing, Yuguang Liu, Jianhong Yang, and Lin Wang. 2010. “The Relation of Chlorophyll-a Concentration with the Reflectance Peak near 700 Nm in Algae-Dominated Waters and Sensitivity of Fluorescence Algorithms for Detecting Algal Bloom.” International Journal of Remote Sensing. https://doi.org/10.1080/01431160902882512.
Zhao, Jun, and Hosni Ghedira. 2014. “Monitoring Red Tide with Satellite Imagery and Numerical Models: A Case Study in the Arabian Gulf.” https://doi.org/10.1016/j.marpolbul.2013.10.057.