Radiometric Intercalibration Workflow
Remote sensing images acquired from different satellites may show differences in brightness values because of sensor characteristics and imaging conditions. To make multi-source nighttime light (NTL) images comparable, a radiometric intercalibration process is required. In this practice, SDGSAT-1 and Yangwang-1 images are used as an example to demonstrate the intercalibration workflow.
The procedure consists of three main steps: identifying stable pixels, estimating the regression relationship between sensors, and applying the derived transformation to perform radiometric correction.
1. Identification of Stable Pixels
The first step of radiometric intercalibration is to identify stable pixels that show little change in nighttime light intensity. These pixels are often referred to as pseudo-invariant pixels (PIPs).
Because disasters may cause large variations in nighttime light intensity, not all pixels can be used for model fitting. Therefore, only pixels with relatively stable brightness values between the two images are selected as training samples.
To identify candidate pixels, threshold segmentation is applied to both SDGSAT-1 and Yangwang-1 images to determine lit areas. Only pixels that belong to the common lit area in both images are retained for further analysis.
Let the selected stable pixels from Yangwang-1 be
and the corresponding RGB values from SDGSAT-1 be
where n denotes the number of selected stable pixels.
2. Regression-Based Sensor Relationship Estimation
After selecting stable pixels, a regression model is used to establish the relationship between the two sensors.
In this practice, the RGB bands of SDGSAT-1 brightness value is modeled as a linear combination of Yangwang-1. The regression model can be written as

where
l i is the brightness value of the i-th Yangwang-1 pixel
r i , g i , b i are the RGB values of the corresponding SDGSAT-1 pixel
α0, α1, α2, α3 are regression coefficients
To improve robustness, an iterative regression process is used to remove outliers. The difference between observed and predicted values is calculated as
where L' denotes the predicted Yangwang-1 brightness values obtained from the regression model.
Pixels with large residual errors are removed from the training dataset, and the regression model is recalculated until the model converges.
3. Radiometric Intercalibration
Once the regression relationship between the two sensors has been obtained, it can be applied to all pixels of the SDGSAT-1 image.
The transformed SDGSAT-1 brightness value can be calculated as
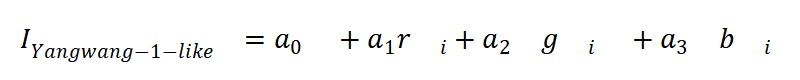
where IYangwang-1-like represents the Yangwang-1-like image generated from SDGSAT-1 data.
After this transformation, the resulting image has brightness values that are consistent with Yangwang-1 observations, allowing the two datasets to be used together for further analysis.
The calibrated Yangwang-1-like image generated from SDGSAT-1 data enables consistent comparison with the observed Yangwang-1 imagery. By combining the pre-disaster Yangwang-1-like image and the post-disaster Yangwang-1 image, a high-resolution nighttime light loss rate map can be derived.
The results shown in Figure 1 demonstrate that the spatial distribution of light loss clearly reflects the impact of disasters. In the Turkey–Syria earthquake cases, large areas with significant nighttime light reduction can be identified in Antakya city.
These high-resolution light loss patterns provide important information about changes in human activities and infrastructure conditions after disasters. Therefore, the radiometric intercalibration approach enables the generation of detailed nighttime light change maps that can support disaster impact assessment, damage evaluation, and post-disaster recovery monitoring.
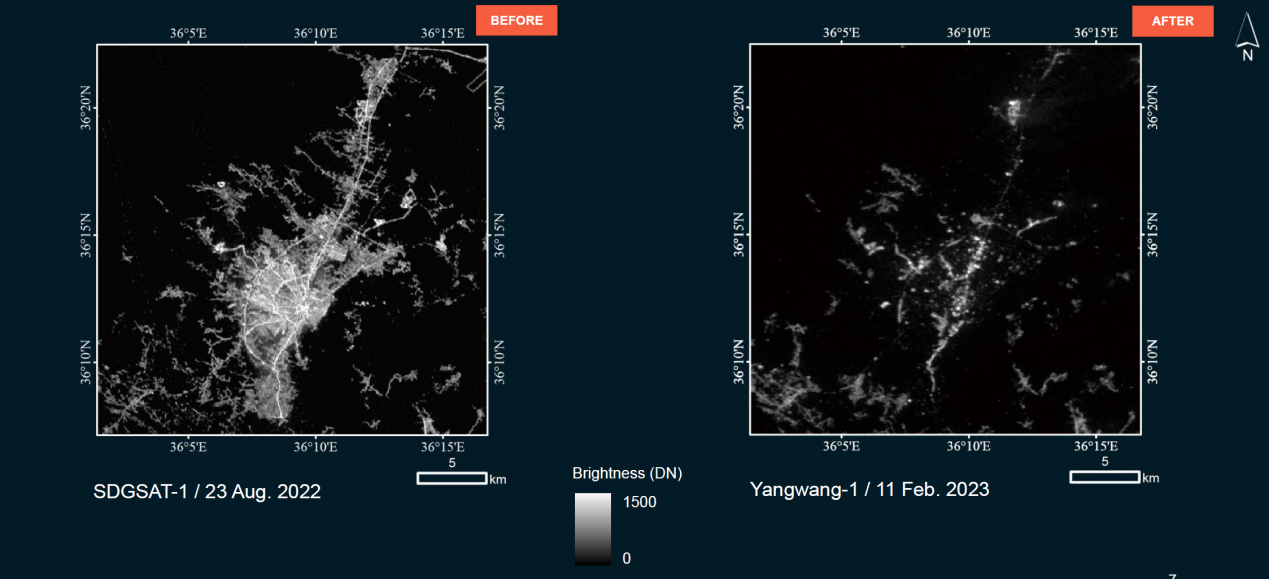
Figure 1. Nighttime light changes in Antakya, Hatay before and after the disaster. The post-disaster Yangwang-1-like image is generated from SDGSAT-1, while the pre-disaster image is acquired by Yangwang-1, enabling consistent comparison of nighttime light intensity.
Image source: UNOSAT report, 2023 (https://unosat.org/products/3497).