![]()
United
Nations
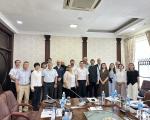
UNOOSA/UN-SPIDER Showcases GeoAI and Digital Twin Innovations at the AI for Good Global Summit 2026
 UNICEF, Rosali Herna, https://news.un.org/en/story/2026/06/1167840")

EO4SDG Book: Earth Observation for Sustainable Development Goals

Earth Observation for Sustainable Development Goals (EO4SDG Book)
The 2030 Agenda for Sustainable Development, adopted by all United Nations Member States in 2015, is a shared blueprint for peace and prosperity for people and the planet.
![]()