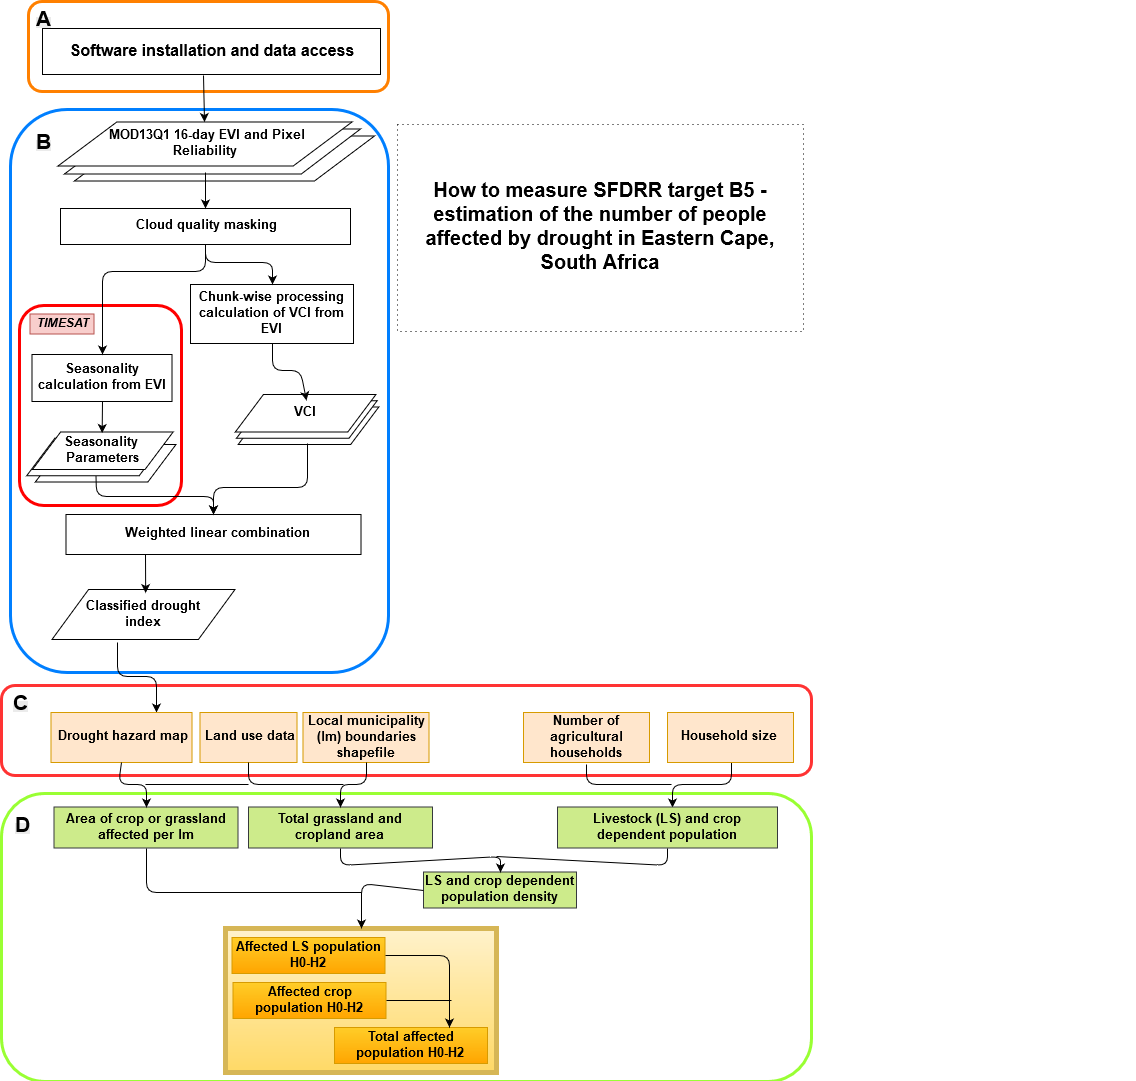
The workflow of Part A and B by ZFL guides the user through the different steps of the drought hazard assessment in R Studio and TIMESAT soft wares. First, the MODIS13Q1 Enhanced Vegetation Index (EVI) satellite data with a temporal resolution of 16 days and a spatial resolution of 250m are downloaded. After the quality masking, the Vegetation Condition Index (VCI) is computed, which represents the percentage of EVI regarding its maximum amplitude of the whole time series at a certain day of the year. Third, seasonal phenological metrics such as the Start of Season (SoS), Peak of Season (PoS) and the End of Season (EoS) are computed for each pixel in TIMESAT. The phenological metrics are used to determine time blocks which are used in a weighted linear combination to average the VCI. Thus, the modified EVI considers the different crop growing stages and vulnerabilities. The outputs of Part A and B are annual drought hazard maps which distinguish three classes: not affected, damaged and destroyed crop and grassland.
The workflow of Part C and D by UNU-EHS uses the output from Part A and B for the year 2015/2016 and combines it with land-use, agricultural and census data. First, the hectares of affected crop and grassland per local municipality are extracted. In this practice, grassland is used as a proxy for affected livestock. The agricultural census data differentiates between farmers working in the livestock and crop sector. Thus, via the densities of agriculture-dependent people (regarding the livestock and crop sectors) per municipality, the number of people affected per hazard class can be estimated. Eventually, the two datasets are combined to estimate the total number of people affected by agricultural drought (B5a+B5b).
Data requirements
All data which is required will be downloaded by either running the script or it is explained where and how to download it in the Step-by-Step descriptions. Thus, the list below is only an overview.
- MODIS13Q1 250m 16-day EVI via https://lpdaacsvc.cr.usgs.gov/appeears/
- Administrative boundaries (provincial ad local municipality level) via Municipal demarcation board (http://www.demarcation.org.za/site/)
- Land cover /land use maps via Department of Environmental Affairs (DEA) (https://egis.environment.gov.za/)
- (Agricultural census data) via Statistics South Africa:
a. www.statssa.gov.za/agricultural_household_provinces/Eastern%20Cape.xlsx
b. http://cs2016.statssa.gov.za/wp-content/uploads/2016/06/CS-2016-Provinces-at-a-glance.pdf
Software requirements
For image processing and further calculations:
- R (at least version 3.3.3) via https://www.r-project.org
- R-Studio version (1.1.442 or newer) via https://www.rstudio.com/
- TIMESAT (version 3.3) via http://web.nateko.lu.se/timesat/timesat.asp
Skill requirements
Intermediate understanding of image processing and basic understanding of R
Hardware requirements
In terms of computing power, a strong machine is recommended for faster processing, although the R script was written in a way that allows calculations on non-high-end machines as well (plan for the calculations to take some days in case you are using a weak machine). The following recommendations are minimum (and tested) specifications:
- 8GB of RAM (16GB of RAM)
- 50GB to 1TB (500GB) of free disk space (heavily dependent on the size of the study area) the use of an external hard drive is possible!
- Dual core processor (Intel i7-2600k, Intel i5)
- An internet connection is required to run the script in order to download all necessary source data. The faster the connection, the better.
This practice was specifically developed for the South African context. Hence, the transferability to other countries and contexts is not failsafe. This section briefly discusses strength and limitations of the workflow, both Part A and B provided by ZFL and Part C and D provided by UNU-EHS. Nonetheless, this list is not extensive and only provides an overview of considerations regarding the usability of the workflows.
Strengths
- All data is free of charge and freely accessible.
- All software is free of charge and freely accessible.
- Contributes to the monitoring processing of the SFDRR.
- VCI is a widely used indicator (e.g. by FAO) and is recommended by WMO for drought hazard assessments.
- Considers crop vulnerabilities and the importance of the timing of a drought.
- Cloudy pixels are removed.
Limitations
- Crop rotation and crop change over the years is a major source of uncertainty for VCI assessments because information on crop condition variation is mixed with variation regarding the phenological cyce of different crop types.
- Irrigated agriculture is more sensitive to changes in EVI: negative changes of the EVI on irrigated land resulted in disproportionally larger changes of the VCI and its classification than on rain-fed land.
- The current concept of the R code assumes that there is only one growing season per year. However, double (bimodal) growing seasons occur in many parts of the world.
- No smoothing of EVI time series was undertaken. A regular step in most time series analysis is the data smoothing: the filter (e.g. Savitzky-Golay- Filter) reduces the number of outliers and noise in the EVI time series but still allows extraction of seasonality parameters.
- Grassland is used as a proxy for livestock. However, drought conditions on grassland do not necessarily result in a loss of livestock.
- It is assumed that all famers in a drought affected area are affected by drought which does not necessarily mean that their livelihoods are damaged or destroyed because the coping capacities of the farmers are neglected here.
- The R code has been developed on Windows,and may run in Mac environments.
Walz, Yvonne, Annika Min, Karen Dall, Moses Duguru, Juan-Carlos Villagran de Leon, Valerie Graw, Olena Dubovyk, Zita Sebesvari, Andries Jordaan, and Joachim Post. “Monitoring Progress of the Sendai Framework Using a Geospatial Model: The Example of People Affected by Agricultural Droughts in Eastern Cape, South Africa.” Progress in Disaster Science, 5 (January 1, 2020): 100062. https://www.sciencedirect.com/science/article/pii/S2590061719300626?via%3Dihub