Pollution
UN-SPIDER Regional Support Offices with hazard-specific expertise
Related content on the Knowledge Portal
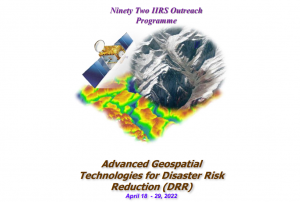
Natural disasters are becoming more frequent and intense across the globe. Enhancing resilience to increasing hazards, exposure, and vulnerability therefore requires leveraging of advanced geospatial technologies for better disaster mitigation and management. With continuous improvements in satellite data sensor acquisition parameters together with geo-computational approaches, geospatial technologies have emerged as the most powerful technology for all phases of disaster management. The course on advanced geospatial technologies for Disaster Risk Reduction (DRR) is scheduled from April 18 - 29, 2022 .
Course Content
- Overview of remote sensing & Geographic Information System
- Application of satellite communication technology for disaster mitigation
- Overview of UAV for disaster monitoring and mitigation
- Emerging geo computation, online GIS & Geo-web services for DRR
- Advanced application of Geospatial…
- Publishing institution:
- Publishing institution:
- This online platform uses data from the Copernicus Sentinel-5P satellite and shows the averaged nitrogen dioxide concentrations across the globe – using a 14-day moving average. Concentrations of short-lived pollutants, such as nitrogen dioxide, are indicators of changes in economic slowdowns and are comparable to changes in emissions. Using a 14 day average eliminates some effects which are caused by short term weather changes and cloud cover. The average gives an overview over the whole time period and therefore reflects trends better than shorter time periods.Publishing institution:
The “Monitoring anthropogenic CO2 emissions with Copernicus” workshop will discuss policy aspects in the context of the European Green Deal and the Paris Agreement. It will present the state of play of the CO2 initiative, address challenges related to the need of in situ measurements, and review progress and opportunities related to the international context and partnerships.
Through the CO2 Monitoring and Verification Support (MVS), the Copernicus programme can help fight climate change drivers, as well as assist policy makers and the scientific community by monitoring and verifying anthropogenic CO2 emissions.
read moreEO4GEO aims to bridge the skills gap between the supply and demand of education and training in the space/geospatial sectors, fostering the uptake and integration of space/geospatial data and services in a broad range of application domains.
The event includes sessions on:
- Introduction to Copernicus and Services (with COVID-19 examples)
- The role of Earth Observation in emergency situations
- NO2 Air pollution monitoring
- Three case studies on how satellite data combined with other data is valued for agriculture, nature conservation and monitoring of forest for detection of fire and diseases
- The role of EO in emergency situations
- Maritime Spatial Planning.
- Publishing institution:
¿Le gustaría saber cómo acceder y visualizar imágenes satelitales de la NASA? La reciente disminución de la contaminación atmosférica a nivel mundial debido al bajón económico ha capturado la atención del mundo entero y recibido mucha cobertura mediática. Inspirándose en ello, esta serie de dos webinars imparte conocimiento fundamental para novatos y sirve de curso de repaso para los demás. Ud. aprenderá cuáles son los contaminantes que se pueden medir desde el espacio, cómo los satélites hacen estas mediciones, lo que se debe hacer y no se debe hacer al momento de interpretar datos satelitales y cómo descargar y crear sus propias visualizaciones.
Objetivos de Aprendizaje:
- Al finalizar esta capacitación, los/las participantes podrán:
- Nombrar los contaminantes que pueden ser observados por satélites de la NASA
- Encontrar y descargar imágenes para NO2 y aerosoles/partículas
- Describir las capacidades y limitaciones de las mediciones…
During this webinar, you will be introduced to Sentinel-5p data and learn how to process the data using the BEAT software. We will demonstrate how using basic analysis, Sentinel-5p data can be used to monitor air quality at regional and global scale.
The webinar is structured as follow:
- Study area
- Remote sensing background
- Introduction to Sentinel-5P
- RUS service
- Exercise
The training will focus on using the BEAT Open Toolbox to process Sentinel-5P data for different trace gas and aerosol in the atmosphere. Attendees will also gain knowledge on Sentinel-5P products and use the data to create world maps of the pollution. They will follow polluting events (such as rain-forest fires, pipeline emissions) with the daily measurement and global coverage of Sentinel-5P. Eventually special focus will be given on quantifying the pollution in a city during distinct periods of the year.
Participants will access a Virtual Machine from their own laptop, to exploit the open-source toolboxes available in the RUS environment and download and process Sentinel-5P data.


