
A consortium of Norwegian institutions has used Copernicus Sentinel-1 satellite data in combination with the Interferometric Synthetic Aperture Radar (InSAR) remote sensing technique to map ground movements in the country. The Geological Survey of Norway (NGU), the Norwegian Water Resources and Energy Directorate (NVE) and the Norwegian Space Centre (NSC) make results freely accessible through InSAR Norway, a service launched in November 2018. The service aims to produce ground deformation measurements in the country and improve accessibility of InSAR results for public and commercial users.
How does InSAR imagery work?
InSAR is used in remote sensing and geodesy, the science of measuring the geometric shape of the Earth. It compares two or more synthetic aperture radar (SAR) images with each other to identify surface movements through time. The images are captured with remote sensing satellites carrying synthetic aperture radar instruments, such as the Copernicus Sentinel-1, transmitting pulses of microwave energy to the Earth's surface and measuring the amount of deflected energy.
Microwave energy is useable in every weather because of its low sensitivity to clouds and rain. This proves to be beneficial for monitoring areas prone to long periods of darkness such as Northern Europe and the Arctic, or providing imagery for emergency response during extreme weather conditions, for instance for flood mapping.
The InSAR Norway portal
The Norwegian Ground Motion Service makes the gathered results publicly available through the online portal InSAR Norway. Images are collected every six days covering two billion measurement sites in Norway. Within one millimeter per year, InSAR maps ground deformation such as subsidence, assesses rock-slide risks and monitors infrastructure in cities. The objective of InSAR Norway is to produce InSAR data and enhance the accessibility for public and commercial use, such as city planning or big data analysis, geotechnique or real estate applications.
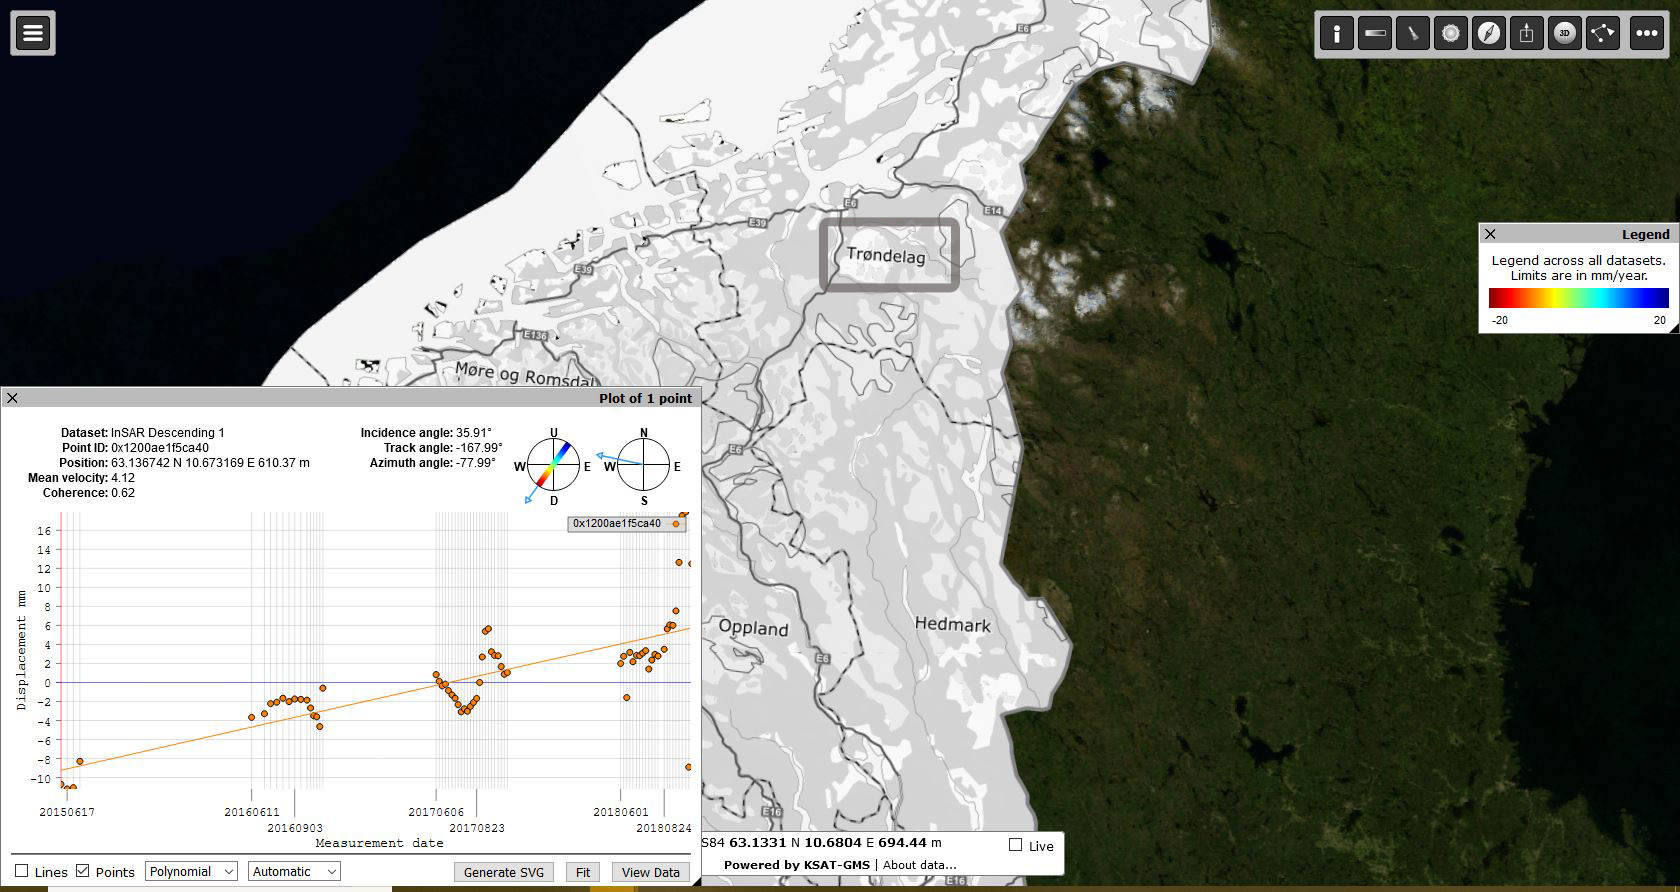
According to scientist John Dehls from NGU "information provided by the InSAR Norway service will be of interest not only for public and commercial entities, but also for citizens; we have thus decided to provide the related data at full resolution, freely and openly to everyone.” Users can click on any point on the satellite-generated map of Norway to view a graph showing all measured plots displacement over time. The View Data button provides detailed information about the plot and a record of the plots measurements. The data can be downloaded as XML-based vector image Scalable Vector Graphics (SVG).
“Furthermore, InSAR Norway data will be maintained and updated at regular intervals, thus creating predictability for long-term operational users", concludes Dehls.
The Earth moves
The movement of mountainsides occurs only by millimetres yearly over hundreds of years, yet the cumulative effect of these movements can be disastrous. Since some Norwegian regions have experienced to rock sliding, one of the most important uses of InSAR Norway is to map and periodically monitor rock slide risk.
The service aims to detect all unstable rock slopes in Norway that could collapse. The geologic conditions of the areas are evaluated and ranked based upon their hazards and risk. This way, a 24/7 monitoring early-warning system is created where necessary.
”New critical areas prone to large landslides were discovered within days of the first data set being produced. These will be followed up with fieldwork next summer”, Dehl states.