Temperature extrema
Definition
Facts and figures
Further information
UN-SPIDER Regional Support Offices with hazard-specific expertise
Related content on the Knowledge Portal
A knowledge platform for adaptation action on climate change recently updated the information, layout and logo of their website. With this step, adaptationcommunity.net aims to improve the user experience of the online platform and consequently facilitate the access to a wide variety of resources on climate change adaptation action, including tools working with Earth observation data.
Adaptation action in the context of climate change refers to “adjustments in ecological, social, or economic systems in response to actual or expected climatic stimuli and their effects or impacts. It refers to changes in processes, practices, and structures to moderate potential damages or to benefit from...
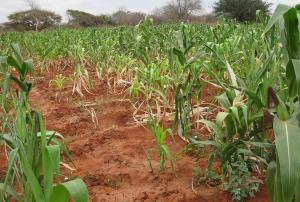
read more12/02/2021A variety of environmental and man-made factors can have a detrimental effect on the yield of farmers worldwide. A programme launched in Kenya, funded by SERVIR in collaboration with NASA Harvest and the Swiss Re Foundation, uses Earth observation (EO) data to assess crop damage and prioritise the mobilisation of financial aid to farmers.
SERVIR is a joint initiative by the U.S. Agency for International Development (USAID) and NASA’s Earth Applied Sciences Program that works with “leading regional organizations world-wide to help developing countries use information provided by Earth observing satellites and geospatial technologies for managing climate risks and land use”. SERVIR both provides access to EO...
read moreRegional Support Offices mentioned:03/03/2021- Publishing institution:
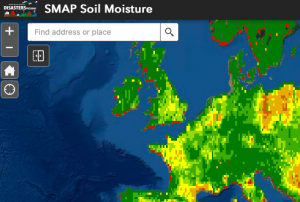
Officially launched in 2015 by the National Aeronautics and Space Administration (NASA), the SMAP mission is an orbiting satellite that measures the amount of wetness in the top layer of soil incrementally every 2-3 days. These Soil Moisture Active Passive (SMAP) measurements rely on radiation frequencies that point to different levels of moisture on the surface of earth’s soil and are useful for scientists because it allows them to construct maps indicating the level of soil moisture globally. Acknowledging the relevance and usability of this data for the field of disaster management, NASA recently integrated the SMAP data into its Disasters Mapping Portal.
The Disasters Mapping Portal has been developed by the Geographic Informations Systems (GIS) Team at NASA in an effort to make their satellite...
read more25/11/2020A new report by the world’s largest humanitarian aid network highlights global disasters, populations most vulnerable to them and the efforts of local institutions in preventing, preparing for and responding to them. The 2020 edition of the World Disasters Report, “Come Heat or High Water”, was launched virtually from the offices of the International Federation of Red Cross and Red Crescent Societies (IFRC) in Vienna on November 16. This year’s report discusses climate- and weather-related disasters and their humanitarian impact. It argues for the usefulness of smart financing and space-based information in disaster management support.
The report warns that the global effort to address climate change is leaving behind...
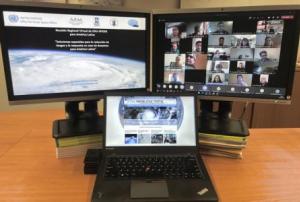
read more19/11/2020En décadas recientes muchas comunidades en América Latina y el Caribe han experimentado desastres ocasionados por inundaciones, sequías, deslizamientos, terremotos, erupciones volcánicas y maremotos o tsunamis que han erosionado los logros asociados a procesos de desarrollo. Además, en este año 2020 la pandemia ocasionada por el virus COVID-19 ha impactado a muchos países del mundo, forzando a los gobiernos, al sector privado, a la sociedad civil y a organismos regionales e internacionales a modificar sus planes de trabajo. De manera paralela, varios países del Este de África, del Sudoeste de Asia y de América Latina están experimentando los impactos de la plaga de langosta.
Convencidos que las tecnologías espaciales pueden jugar un papel preponderante en apoyar los esfuerzos que llevan a cabo las instituciones en materia de gestión para la reducción de riesgos, la preparación, la respuesta y la recuperación en caso de desastres; la Asamblea General de las...
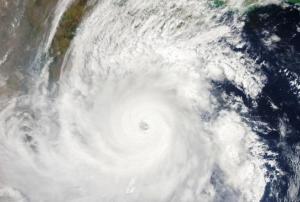
read moreRegional Support Offices mentioned:According to the latest issue of an annual disaster statistics report, floods were the deadliest type of disasters in 2019, followed by extreme temperature, while storms affected the highest number of people. Published by the Centre for Research on the Epidemiology of Disasters (CRED), “Natural disasters 2019 - Now is the time to not give up” draws on data recorded in the Emergency Events Database (EM-DAT), which saw the addition of 396 disasters that affected a total of 95 million and caused $103 billion in economic losses around the world.
Accounting for 40 per cent of disaster events, Asia suffered the highest impact with 45 per cent of deaths and 74 per cent of total affected. India, which saw cyclone Fani cause destruction in 2019, was the country most...
read more20/08/2020- Publishing institution:
The Japan Aerospace Exploration Agency (JAXA) has released the JAXA Climate Rainfall Watch website to monitor extreme weather and climate over the world. The website provides hourly global measurements of precipitation as well as forecasts about heavy rainfall and drought in different temporal scales (daily, pentad, weekly, 10-days and monthly). The satellite-based global rainfall maps produce highly accurate measurements that can help better understand the changing climate, improve forecasts of extreme weather events, such as floods and droughts, minimize their damage and strengthen early warning systems.
The Climate Rainfall Watch website monitors heavy rainfall and drought in near-real-time and collects and stores data from previous months. The website calculates rainfall in percentile: heavy rain is indicated by...
read more15/04/2020The training date is in the past. However, videos and resources of the training can be accessed here.
This four-part introductory webinar will focus on data products, data access, and case-studies demonstrating how remote sensing data can be used for decision-making among the agriculture and food security communities.
This training will address how to use remote sensing data for agriculture monitoring, specifically drought and crop monitoring. The webinar will also provide end-users the ability to evaluate which regions of the world agricultural productivity is above or below long-term trends. This informs decisions pertaining to market stability and humanitarian relief.
By the end of this training, attendees will be able to:
- Identify which satellites and sensors can be used for...


