Earthquake
Definition
Facts and figures
Further information
UN-SPIDER Regional Support Offices with hazard-specific expertise
Related content on the Knowledge Portal
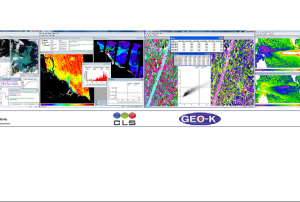
Welcome to the fascinating world of Radar tomography. This tutorial presents a set of training resources for the introduction into this advanced Radar remote sensing technique. The material consists of the following components
A theory unit comprising Slides on Basics, Concepts & Techniques
An interactive Python tutorial including a Jupyter Notebook
Free Test data from the airborne F-SAR platform
An explanation video on how to use the tutorialThe module SAR Tomography introduces the advanced technique of combining multiple radar images from several viewing angles into a new dimension of information. Although tomogoraphic measuring systems and applications are recently in an experimental stage, this technology has a large potential to enhance the information content of radar data. This module gives an overview of the basics, limitations, mathematical foundations, advanced techniques and recent case studies.
Related…
read more- Publishing institution:
- Publishing institution:
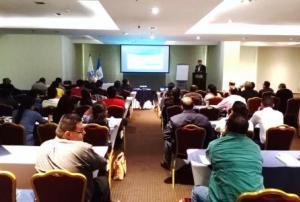
UN-SPIDER and the National Secretariat for Science and Technology of Guatemala (SENACYT) join forces to conduct a seminar on the use of science, technology and innovation in disaster risk reduction and response efforts. The seminar entitled "Science and Technology: Applications for Disaster Preparedness and Response in Latin America and the Caribbean. Guatemala:…
read more- The Hazards Mapper home page is a base map of the world with darker shaded areas indicating higher population densities. Custom population estimates generated by the Hazards Mapper are provided by SEDAC’s Population Estimation Service (PES). Population and settlement data are based on SEDAC’s Global Rural-Urban Mapping Project (GRUMP) and Gridded Population of the World, version 3 (GPWv3) data collections. GPWv3 provides a resolution of roughly 4 km (2.5 miles) at the equator. This population resolution will increase significantly when the updated version, GPWv4, is released in 2016. “Our new population layer will be at a resolution of 1 km (0.6 miles) at the equator, which will give higher precision for smaller areas,” says de Sherbinin.
Continuously updated data layers that can be overlaid on the base map are available from NASA’s EOSDIS, including data from SEDAC; NASA's Land, Atmosphere Near real-time Capability for EOS (LANCE); and Global Imagery Browse…, The default base map includes:
Red dots indicating fires and other hotspots detected over the past 48 hours by NASA’s Moderate Resolution Imaging Spectroradiometer (MODIS) instrument;
Colored circles indicating earthquakes over the past seven days from the USGS Earthquake Hazards Program;
Icons indicating the location of individual dams, dam clusters, and nuclear power plants from SEDAC’s Global Reservoir and Dam and Population Exposure Estimates in Proximity to Nuclear Power Plants, Locations databases; and,
Colored polygons indicating tornado and flood warnings issued by NOAA (U.S. locations only).
Publishing institution: - Hazards and Population Mapper (HazPop) is a free app that enables users to easily display recent natural hazard data in relationship to population, major infrastructure, and satellite imagery. Hazards data include the location of active fires over the past 48 hours; earthquake alerts over the past seven days; and yesterday′s air pollution data measured from space. The app shows the location of major dams and nuclear power plants and provides more detailed information and imagery for these facilities where available. By drawing a circle around a point or area of interest on the map, users can obtain an estimate of the total population and land area enclosed within., Developed by the NASA Socioeconomic Data and Applications Center (SEDAC) operated by the Center for International Earth Science Information Network (CIESIN) at Columbia University, HazPop combines data and map layers from various sources including NASA's Land, Atmosphere Near real-time Capability for EOS (LANCE) and Global Imagery Browse Services (GIBS), the U.S. Geological Survey (USGS), and others using a variety of open Web mapping services. The custom population estimates are provided by the SEDAC Population Estimation Service (PES) based on SEDAC′s Gridded Population of the World, version 4 (GPWv4) data for 2015.Publishing institution:
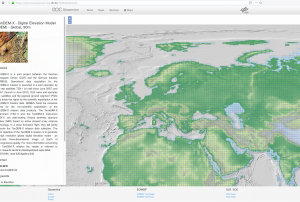
- The accuracy of the TanDEM-X 90m DEM relates to the TanDEM-X 12m (0.4 arcsec) DEM products from which it has been derived. For the 12m DEM: the Absolute horizontal and vertical accuracy is below 10m. The relative vertical accuracy expressed as linear errors at 90% confidence level (LE90) for slopes at or below 20% at 2m, and for slopes above 20% at 4m.
The TanDEM-X 90m DEM product is delivered in a compressed ZIP (*zip) format. Each zip file contains a main folder, which contains basically the meta data of the product in XML (*.xml) format. In the main folder there are 3 subfolders:
DEM: The DEM raster layer
AUXFILES: The 7 information raster layer
PREVIEW: All quicklook raster and KML files
Publishing institution:


