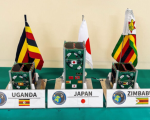
The Zimbabwe National Geospatial and Space Agency (ZINGSA) has confirmed that Zimbabwe's first earth-observation satellite, ZimSat-1, is operational and has commenced the downlink and uplink functions after a successful orbital stabilisation.
This is event is available for participation on an ongoing basis
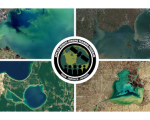
This advanced-level training will focus on using remote sensing observations from Landsat 8 and 9, Sentinel-2, and Sentinel-3 for assessing water quality parameters, including chlorophyll-a concentration, turbidity, and Total Suspended Solids (TSS) in inland lakes. This training will also highlight the importance of in situ measurements of these parameters, coincident with satellite observations, in developing methodologies for operational water quality monitoring.
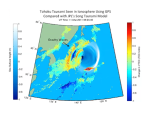
Scientists at the U.S. National Aeronautics and Space Administration (NASA) are testing a novel approach to detect tsunamis by the rumble they make in the atmosphere.The new hazard-monitoring technology, called GUARDIAN (GNSS Upper Atmospheric Real-time Disaster Information and Alert Network), uses GPS signals to go wave-hunting in the Pacific Ring of Fire.
UNOOSA's Annual Reports describe the Office's work in promoting international cooperation for the peaceful use and exploration of space, and in the use of space science and technology for sustainable economic and social development. They also illustrate statistics and provide key facts about UNOOSA.
The Annual Reports function not only as an activities report to the members of the United Nations Committee on the Peaceful Uses of Outer Space, but also as an awareness-raising tool for UN member states and the public.
This is event is available for participation on an ongoing basis
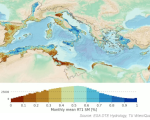
The 6th World Landslide Forum “Landslides Science for sustainable development” will be held in Florence at the Palazzo dei Congressi from 14 to 17 November 2023.
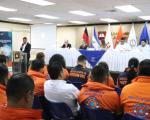
Like many other countries of the world, El Salvador faces the frequent impact of floods triggered by tropical storms and hurricanes. Since 2014, UN-SPIDER has been providing advisory support to the Directorate of Civil Protection of El Salvador and other government agencies on the use of space technologies and space-based information to confront the challenges of floods and other natural training courses.
This is event is available for participation on an ongoing basis
The role of information technology (IT) in disaster situations is becoming more critical in this recent years, especially in mitigating and reducing the risks associated with the disaster effects. Modern information and communication technologies can significantly facilitate the decision-making processes from the point of view of disaster risk reduction.