![]()
United
Nations
Climate Adaptation in Africa: Join the ClimateSCOpe Webinar
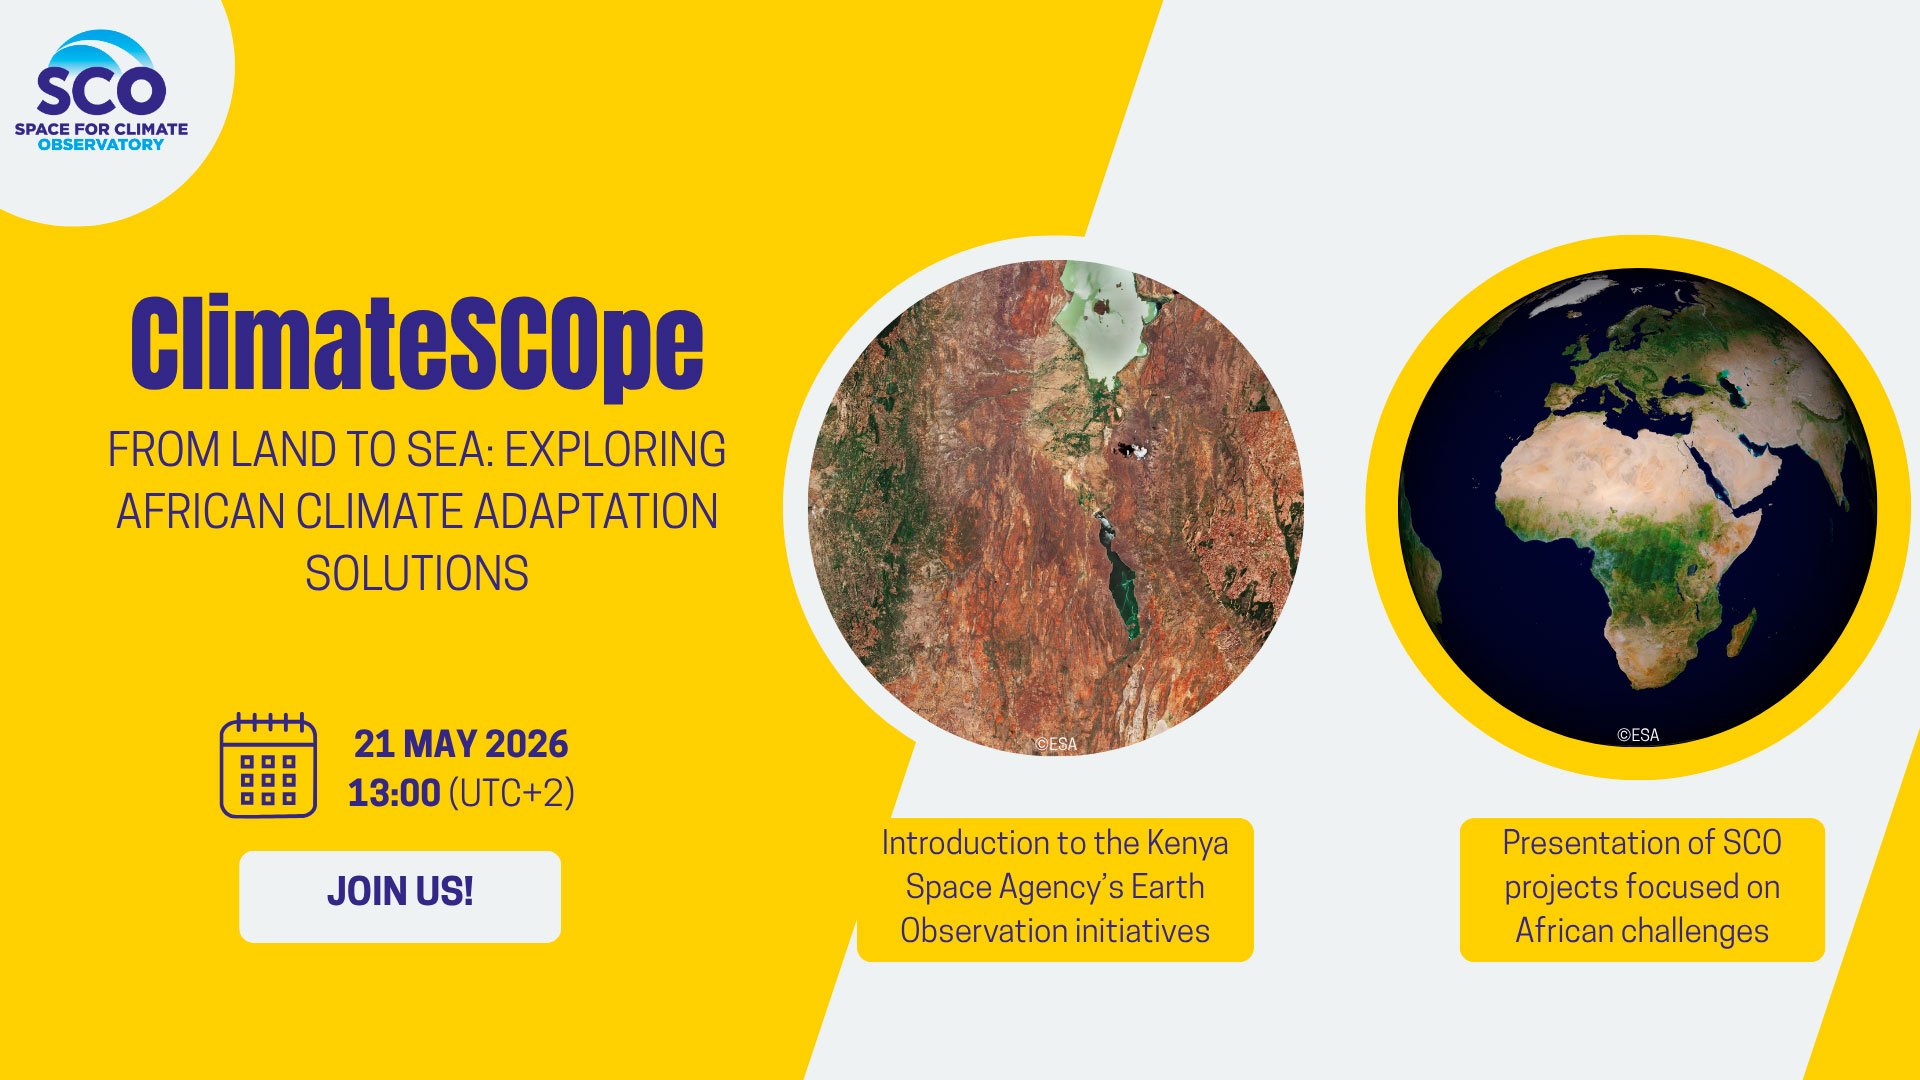
🌍 How can satellite data support climate adaptation efforts across Africa?
On 21 May 2026 at 1:00 p.m. UTC+2, the 4th edition of ClimateSCOpe will bring together partners and experts to showcase innovative initiatives using Earth observation and space-based technologies to strengthen climate resilience across the continent.
The University of the West Indies (UWI)
The UWI is a regional university of higher education learning and research, which has been charged with the mission of advancing education and creating knowledge through excellence in teaching, research, innovation, public service, intellectual leadership and outreach in order to support the inclusive (social, economic, political, cultural and environmental) development of the Caribbean region and beyond. The UWI has its Centre Headquarters in Kingston, Jamaica and operates from the following Campuses: the Mona Campus situated at Mona in Kingston, Jamaica; the Cave Hill Campus situated at Cave Hill in Barbados; the St. Augustine Campus situated at St. Augustine and Debe in Trinidad and Tobago, the Five Islands Campus situated at St. John’s in Antigua and Barbuda and the UWI Global Campus, which serves seventeen countries within the Caribbean region inclusive of the four aforementioned territories. The Imperial College of Tropical Agriculture, established in 1921 was the basis for the founding of the UWI, St. Augustine Campus in 1960. Over the last few decades, in addition to Agriculture, the UWI added several programmes in Engineering, Social Sciences, Humanities and Education, Science and Technology, and Sports.


![]()